
Reminding You Why You Should Be Selling In May
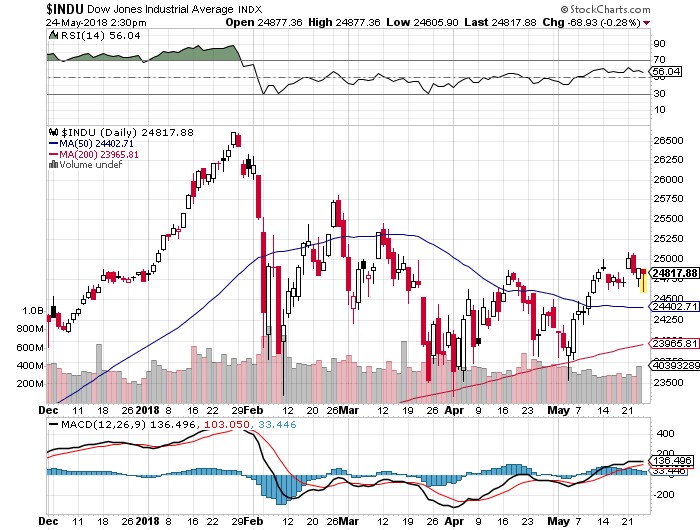
Followers of my Trade Alert service have watched me shrink my book, reduce risk, and cut positions to a rare 100% cash position. No, I am not having a nervous breakdown, a midlife crisis, nor have I just received a dementia diagnosis. It’s because I am a big fan of buying straw hats in the dead of winter and umbrellas in the sizzling heat of the summer. I even load up on Christmas ornaments every January when they go on sale for 10 cents on the dollar.
There is a method to my madness. If I had a nickel for every time that I heard the term “Sell in May and go away,” I could retire. Oops, I already am retired! In any case, I thought that I would dig out the hard numbers and see how true this old trading adage is. It turns out that it is far more powerful than I imagined.
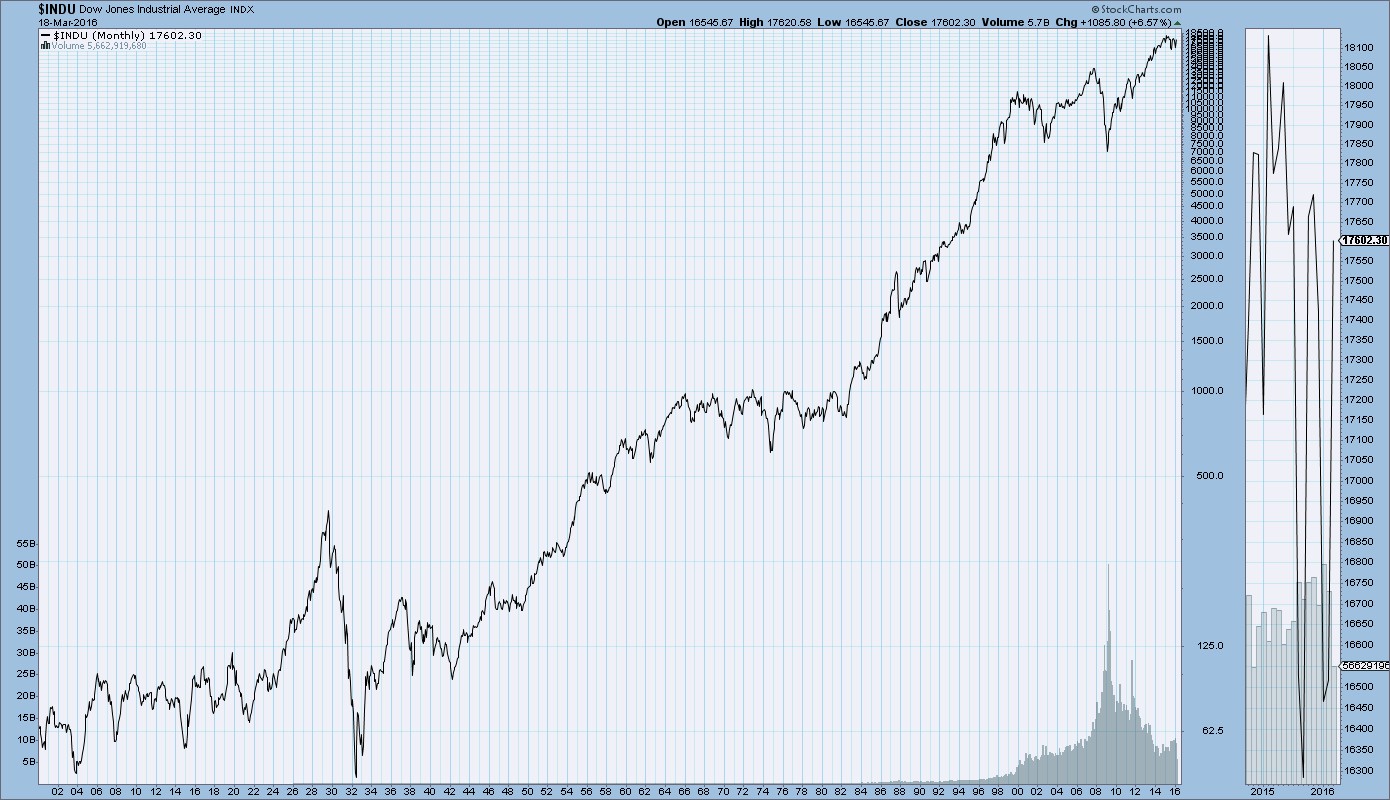
According to the data in the Stock Trader’s Almanac, $10,000 invested at the beginning of May and sold at the end of October every year since 1950 would be showing a loss today. Amazingly, $10,000 invested on every November 1 and sold at the end of April would today be worth $702,000, giving you a compound annual return of 7.10%! This is despite the fact that the Dow Average rocketed from $409 to $26,500 during the same time period, a gain of 64.79 times!
Since 2000, the seasonal Dow has managed a feeble return of only 4%, while the long winter/short summer strategy generated a stunning 64%. Of the 68 years under study, the market was down in 25 May-October periods, but negative in only 13 of the November-April periods, and down only three times in the past 20 years! There have been just three times when the "good 6 months" have lost more than 10% (1969, 1973 and 2008), but with the "bad-six month" time period there have been 11 losing efforts of 10% or more.
Being a longtime student of the American, and indeed, the global economy, I have long had a theory behind the regularity of this cycle. It’s enough to base a pagan religion around, like the once practicing Druids at Stonehenge. Up until the 1920s, we had an overwhelmingly agricultural economy.
Farmers were always at maximum financial distress in the fall, when their outlays for seed, fertilizer, and labor were the greatest, but they had yet to earn any income from the sale of their crops. So, they had to borrow all at once, placing a large cash call on the financial system as a whole. This is why we have seen so many stock market crashes in October. Once the system swallows this lump, it’s nothing but green lights for six months.
After the cycle was set and easily identifiable by low-end computer algorithms, the trend became a self-fulfilling prophecy. Yes, it may be disturbing to learn that we ardent stock market practitioners might in fact be the high priests of a strange set of beliefs. But hey, some people will do anything to outperform the market.
It is important to remember that this cyclicality is not 100% accurate, and you know the one time you bet the ranch, it won’t work. But you really have to wonder what investors are expecting when they buy stocks at these elevated levels, over $205 in the S&P 500 (SPY).
Will company earnings multiples further expand from 19X to 20X or 21X? Will the GDP suddenly reaccelerate from a 2% rate to the 4% promised by the new administration, when the daily sentiment indicators are pointing the opposite direction?
I can’t wait to see how this one plays out.
The Diary of a Mad Hedge Fund Trader, published since 2008, has become the top performing trade mentoring and research service in the industry, averaging a 34.84% annual return for ...
more

