
Questioning The Bullish Trend

Market Update
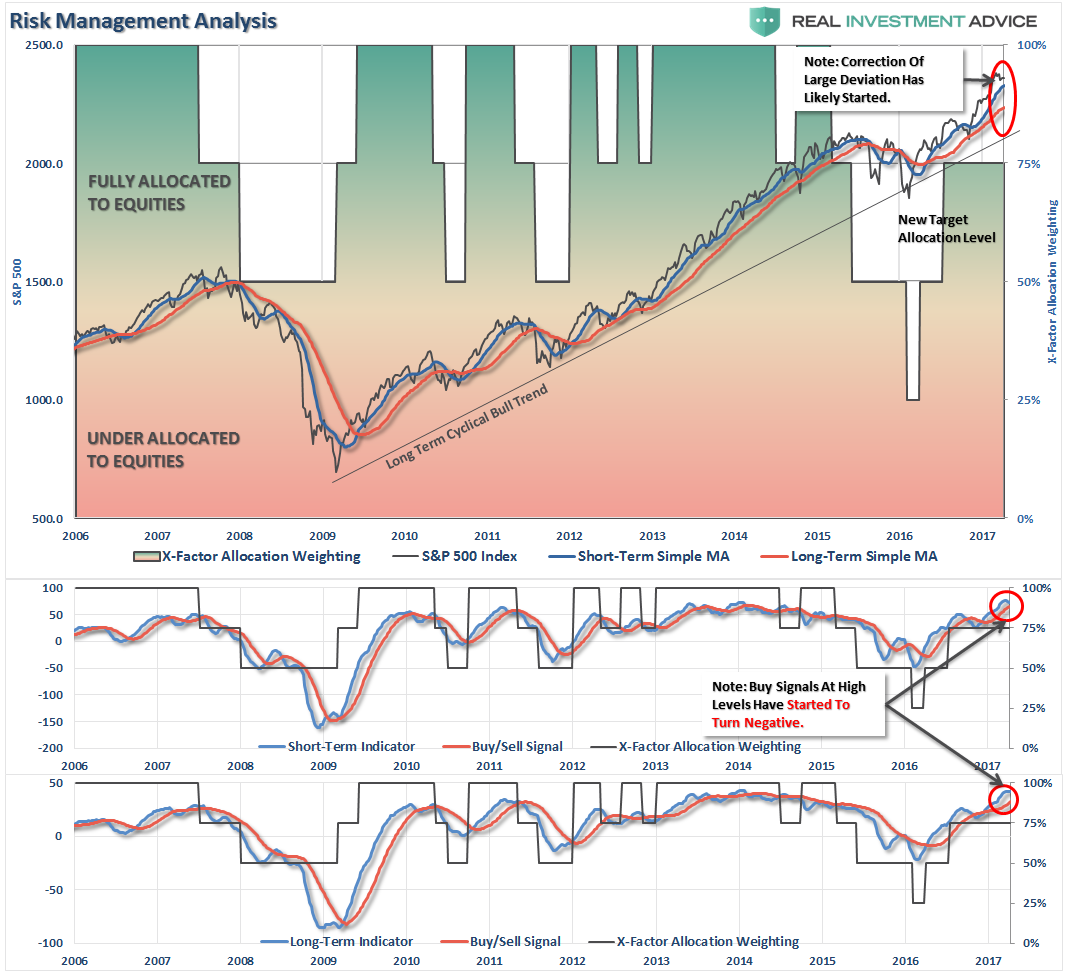
This past week continues to show the underlying resilience of the current bull market. Despite weaker economic data, a surprise attack on Syria and continuing failures by Congress to move legislative mandates forward, the market, as shown below, continues to maintain its bullish bias. The short-term “sell signal,” as noted at the bottom of the chart, has kept new money from being allocated currently as it suggests further volatility in the week ahead.
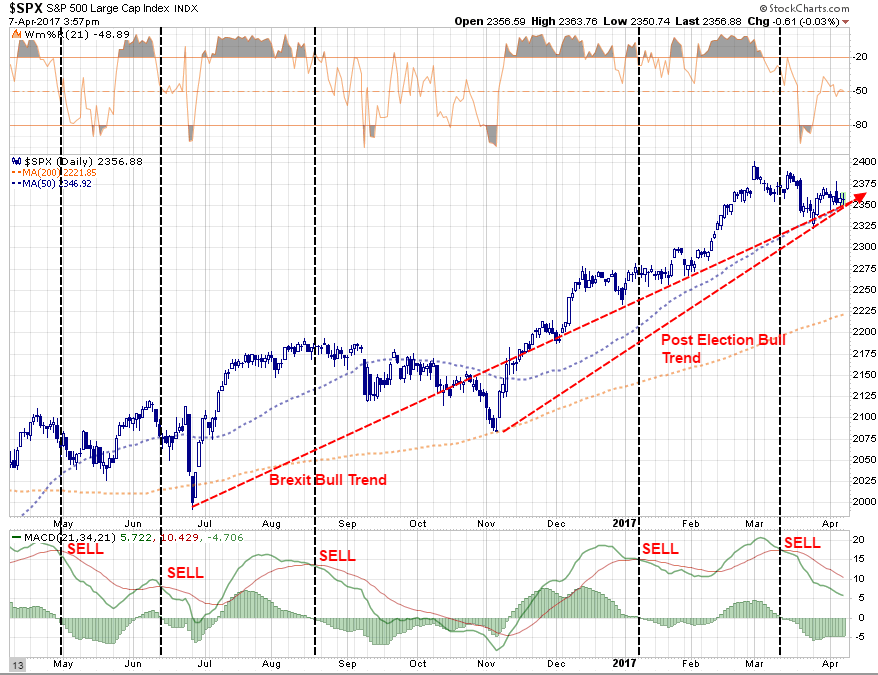
As discussed last week, portfolios remain nearly fully allocated to the markets BUT have been adjusted for short-term tactical positioning. However, on an intermediate-term basis, the markets remain grossly overbought and very extended. As such, the possibility of a correction has risen markedly. The Fibonacci retracement levels suggest a pullback could take the market back to roughly 2100-2150 which equates to a decline of -8.7% to -10.8%. Of course, while such a pullback is well within norms in any one-year period, given the extreme levels of complacency by investors such a correction will “feel” much worse.

Furthermore, the current extension of the market above the long-term moving averages continues to suggest caution in the intermediate term as the magnitude of a normal corrective action has been increased by the recent surge in prices. As shown below, volatility currently remains suppressed as some of the overbought conditions have been reduced. However, there is still a good bit of work to do in terms of the current consolidation process to allow the moving average to catch up to prices and not vice-versa.

As stated, portfolios remain bullishly allocated for now but with a cautious underpinning. We are still maintaining hedges until the current corrective action completes. Furthermore, we are currently maintaining “new money” in short-term cash positions and only selectively stepping into core long-term holdings with tight stop-loss levels.
April Stats
However, as I discussed on Tuesday:
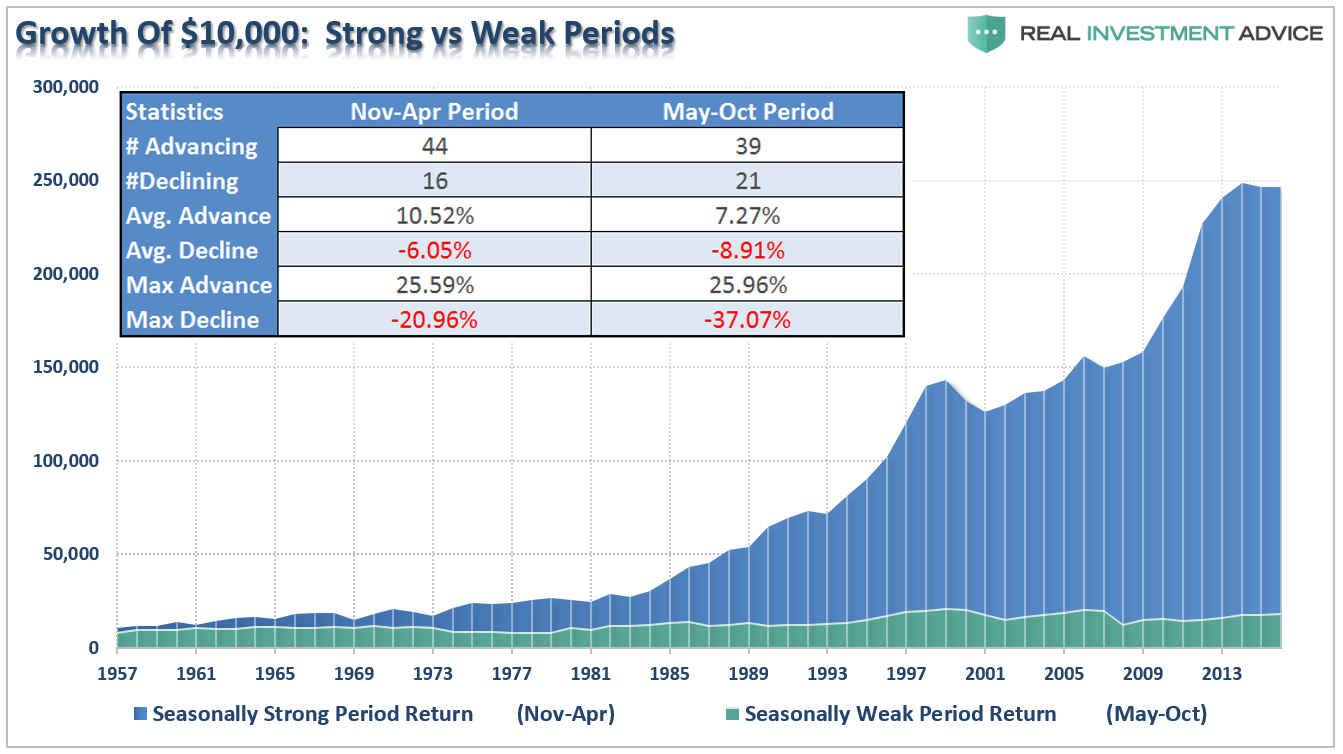
“April begins the last leg of the market’s ‘seasonally strong’ period of the year, which is where the idea of ‘Sell In May And Go Away’ comes from. Of course, every year, there is always a litany of articles written about why it is such a bad idea, you need to just ‘buy and hold’, blah…blah…blah.
Importantly, ‘Selling in May’ does not necessarily mean ‘going all to cash,’ so can we please stop using extremes to try and prove a point. ‘Selling In May,’ at least in my world, is the process of reducing risk during a period time where historical returns have tended to be poor. Take a look at the chart below which shows a $10,000 investment into markets during the ‘Seasonally Strong’ vs. ‘Seasonally Weak’ periods. Did you really miss anything by skipping the summer months?”
While the month of March was lackluster at best in terms of performance, April has historically tended to be a better month overall. However, as we enter into the second quarter of the year there are several things that we need to focus on:
- Seasonal adjustments, which have given a massive boost to recent economic reports due to the unseasonably warm winter cycle, will begin to revert as temperatures realign with more normal seasonal patterns.
- While earnings estimates have been dropped markedly to allow companies to play the “beat the estimate” game, profits and revenues will likely be weaker than currently expected as recent auto sales, employment and retail sales numbers are suggesting.
- April is the beginning of the end of the seasonally strong time of the year.
If the above turns out to be correct, then I suspect an April push back to old highs will likely provide the opportunity to rebalance overall portfolio risk.
If we look at the month of April going back to 1960 we find that there is a bias for the month to end positively 67% of the time. In other words, 2 out of every 3 April months finished in positive territory which is why it is included in the seasonally strong period of the year.
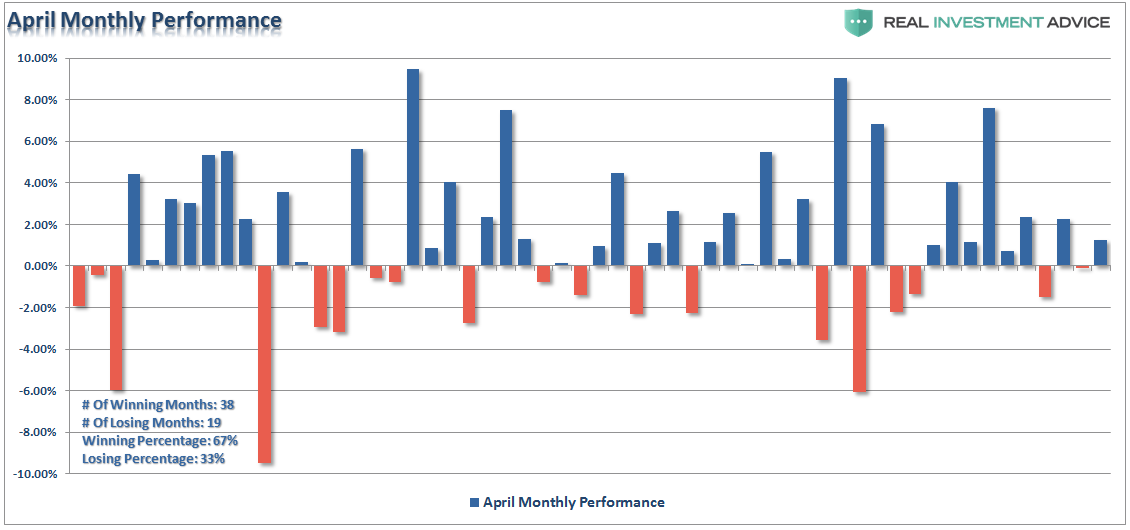
Unfortunately, the declines in losing months have wiped out the gains in the positive months leaving the average return for April almost a draw (+.01%)

However, a look at daily price movements during the month, on average, reveal the 5th through the 10th trading days of the month are the weakest followed by the end of the month. It is during this middle part of the month that either the market holds support OR begins a deeper corrective action.

Importantly, going back to 1957, it should not be a foregone conclusion that April will end in positive territory. While the statistical odds currently favor such a scenario, it does not mean it will be the case.
Questioning The Bullish Trend
While there is NO QUESTION the bullish trend currently remains intact, the release of the FOMC minutes revealed that even the Federal Reserve has begun to question the efficacy of the bull market.
Just to remind you, the entire catalyst behind the post-election rally has been the “hope” that tax cuts will boost earnings enough to support current market valuations. However, interestingly, while the markets continue to hope for “fiscal policy” reforms, according to the release of the FOMC minutes there is little consideration being given to Trump’s agenda. From the minutes:
“Participants continued to underscore the considerable uncertainty about the timing and nature of potential changes to fiscal policies as well as the size of the effects of such changes on economic activity. However, several participants now anticipated that meaningful fiscal stimulus would likely not begin until 2018. In view of the substantial uncertainty, about half of the participants did not incorporate explicit assumptions about fiscal policy in their projections.”
Furthermore, the FOMC also raised concerns over the level of valuations in the markets.
“Broad US equity price indexes increased over the inter-meeting period, and some measures of valuations, such as price-to-earnings ratios, rose further above historical norms. A standard measure of the equity risk premium edged lower, declining into the lower quartile of its historical distribution of the previous three decades. Stock prices rose across most industries, and equity prices for financial firms outperformed broader indexes.“
Just for the record, here are both measures. The first chart below is the Cyclically Adjusted P/E ratio and its inverse Earnings Yield (see this for an explanation.)

Currently, the implied Risk Premium for U.S. equities is in the bottom third of its long history. While there are many suggesting we have entered into a new “secular bull market,” the related risk premium of investing in equities over “risk-free” assets suggests differently.
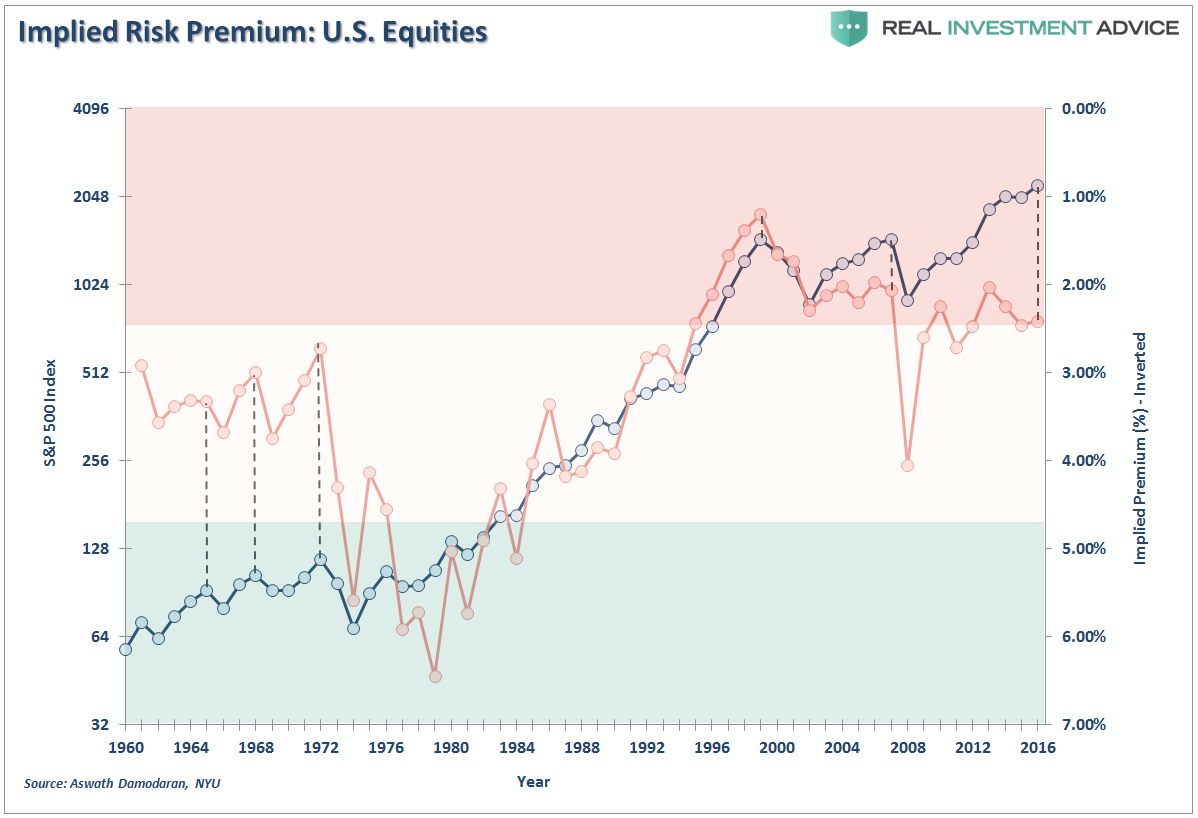
“No matter how you value the market, it is simply expensive.”
Combine rich valuations with over confidence and the markets have tended to have poor outcomes.
Lastly, the Fed minutes also touched on the detachment between the “hard” and “soft” economic data. While there have been numerous articles recently suggesting the economy will catch up with the current levels of optimism, the recent employment and economic data suggests some caution.
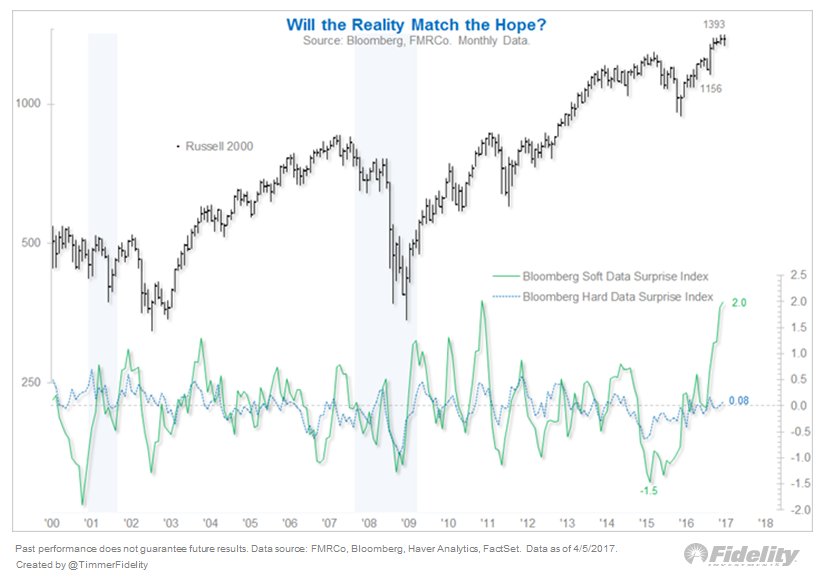
With Q1-GDP currently tracking near 0.6%, as noted by the Atlanta Fed GDPNowCast on Friday, the “Trump Confidence” boost has yet to materialize in actual activity.
Bullish For Now, Bearish Later
I wrote previously a piece on the problem with “Buy and Hold” investing. The crux of the article is that spending a bulk of your time making up lost gains is hardly a way to build wealth longer-term. More importantly, is the consideration of “time” in that equation. Unless you discovered the secret of immortality, “long-term” is simply the amount of time between today and the day you will need your funds for retirement.
Of course, such articles always derive a good bit of push back suggesting that individuals cannot effectively manage their own money, therefore, indexing is their only choice.
I simply disagree.
Yes, managing risk in a portfolio will create underperformance over short-term periods BUT much less than being overly exposed to equities during a period of decline.
As I have stated previously, participating in the bull market over the last eight years is only one-half of the job. The other half is keeping those gains during the second half of the full market cycle.
In other words, while the bull market is intact, remain “bullish”. Just don’t forget you also need to be “bearish” later.
If the market breaks support, the subsequent decline will quickly wipe out the gains of the year. The probability of such happening in the months ahead is roughly 71% as discussed last week.
The purpose of risk management is to protect investment capital from being destroyed which has two very negative consequences.
- When investment capital is destroyed, there is less capital to reinvest for future gains.
- The destruction of compounded returns. Small losses in principal can quickly erode years of gains in wealth.
Raising cash and protecting the gains you have accrued in recent years really should not be a tough decision. Not doing so should make you question your own discipline and whether “greed” is overriding your investment logic.
While the financial press is full of hope, optimism and advice that staying fully invested is the only way to win the long-term investing game; the reality is that most won’t live long enough to see that play out.
You can do better.
Market & Sector Analysis
Data Analysis Of The Market & Sectors For Traders
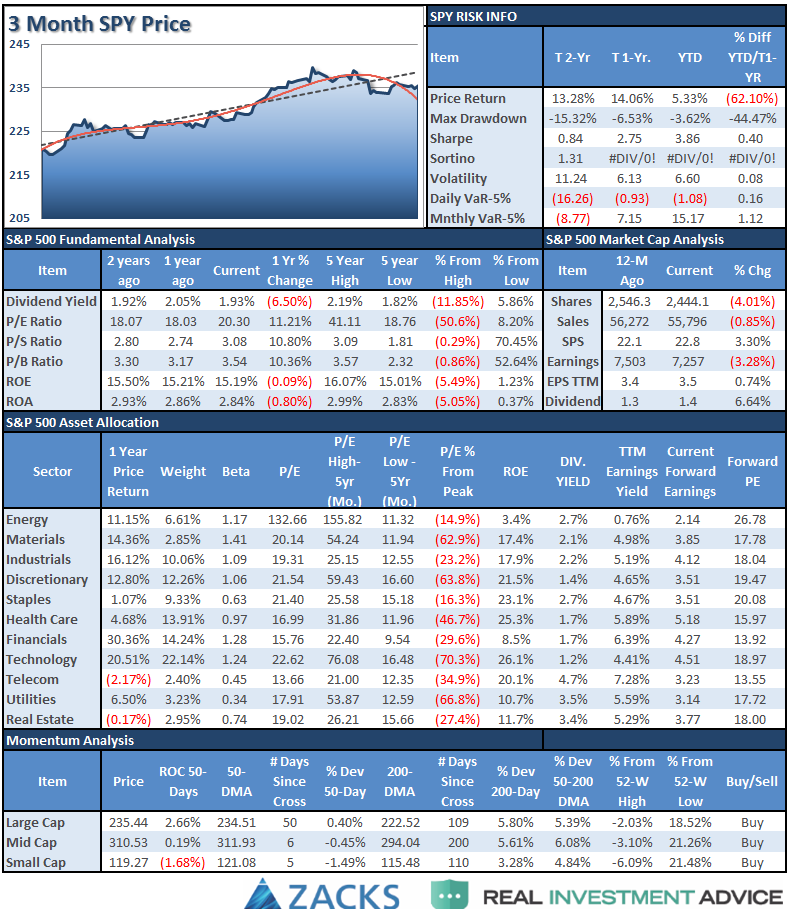
S&P 500 Tear Sheet
The “Tear Sheet” below is a “reference sheet” provide some historical context to markets, sectors, etc. and looking for deviations from historical extremes.
Sector Analysis
As stated above, the short-term corrective process over the last few weeks has reversed SOME of the overbought conditions (see short-term chart above). However, longer-term dynamics still suggest maintaining a more cautious approach to risk-based allocations.
As suggested two weeks ago, the conditions present suggest a continued rally attempt over the next few days. However, up to this point, rally attempts have continued to fail which suggests risk currently to portfolio allocations. Therefore, I continue to suggest that any rally attempt continuing over the next few days of April should be faded until strength returns to the market.
Remain cautious currently as the “risk off” trade has continued to advance over the last week.
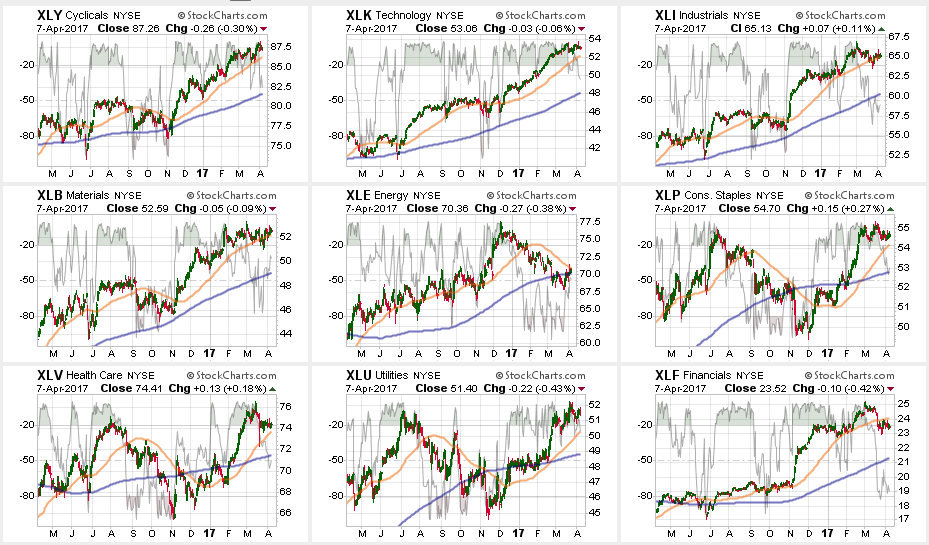
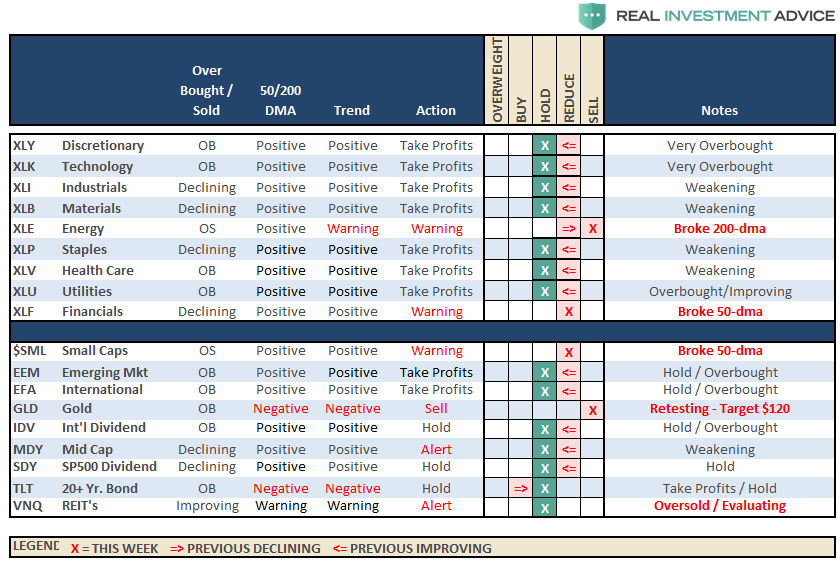
Technology, Industrial, Materials, and Discretionary sectors continue to struggle with their respective 50-day moving averages. While still trending positively, relative performance has weakened substantially for now.
Energy continues to struggle after breaking its 50-dma and broke its 200-dma two weeks. While energy had a bit of a bounce this week and is testing resistance at the 50-dma and the trend is materially weakening. While oil prices did hold the critical support level of $48, supplies are continuing to build which suggest the bounce may be transient. Caution in this sector remains highly advised until the technical backdrop improves.
Financials have broken their 50-dma, tested the underside of that average and failed as I suggested might be the case last week. Underweight the sector for now.
As I stated a month ago:
“Utilities, Healthcare, and Staples had their respective 50-dma cross back above the 200-dma suggesting a much better buying opportunity on sector pullbacks in the future.”
We are now looking to add to our current holdings if a short-term “buy signal” is registered for the broader market. Such has not happened as of yet.

Small and Mid-Cap stocks continued to weaken in terms of relative performance and are breaking their respective 50-dma’s. The deterioration of relative strength continues to suggest caution.
Emerging Markets, International, and Dividend Yield Stocks are again very overbought. The bull trend is still intact but some profit taking and rebalancing is advised.
Bonds and REIT’s got oversold three weeks ago and performance has continued to improve this past week. If the broad markets run into further trouble look for a continued rotation in the “safety trade.” However, bonds are now very overbought so taking some profits and waiting for a correction to add further exposure makes sense.
The table below shows thoughts on specific actions related to the current market environment.
(These are not recommendations or solicitations to take any action. This is for informational purposes only related to market extremes and contrarian positioning within portfolios. Use at your own risk and peril.)
Portfolio Update:
After hedging our long-equity positions 16-weeks ago with deeply out-of-favor sectors of the market (Bonds, REIT’s, Staples, Utilities, Health Care and Staples) we did rebalance some of our long-term CORE equity holdings back to original portfolio weightings harvesting a bit of liquidity.
The short-term bullish trend is still very positive which keeps us allocated on the long-side of the market. HOWEVER, the technical setup required for an increase in equity risk in portfolios is IMPROVING on a TACTICAL (very short-term) BASIS.
As noted above:
“Portfolios remain bullishly allocated for now but with a cautious underpinning. We are still maintaining hedges until the current corrective action completes. Furthermore, we are currently maintaining ‘new money’ in short-term cash positions and only selectively stepping into core long-term holdings with tight stop-loss levels.”
If a buy signal is registered in the next week, I will adjust equity allocations in portfolios accordingly. However, we continue to maintain very tight trailing stops as the mid to longer-term dynamics of the market continue to remain very unfavorable.
THE REAL 401k PLAN MANAGER
The Real 401k Plan Manager – A Conservative Strategy For Long-Term Investors
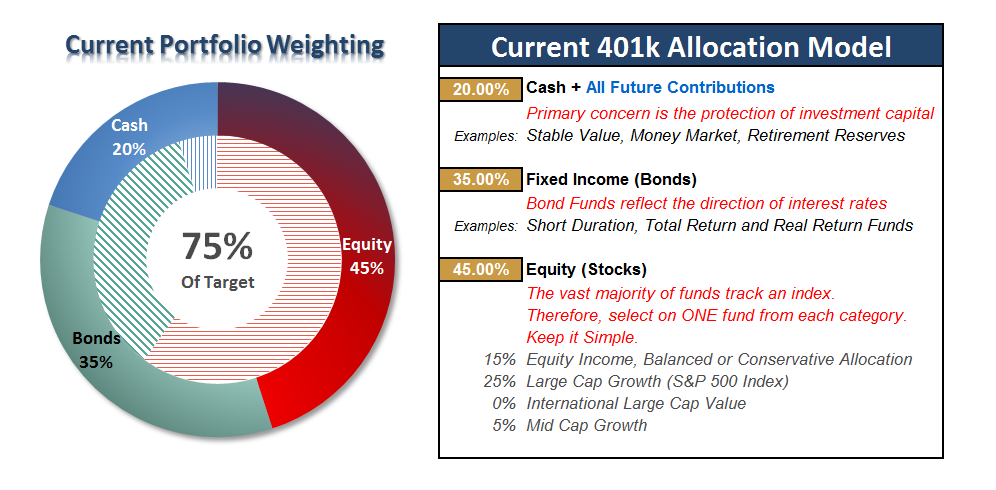
There are 4-steps to allocation changes based on 25% reduction increments. As noted in the chart above a 100% allocation level is equal to 60% stocks. I never advocate being 100% out of the market as it is far too difficult to reverse course when the market changes from a negative to a positive trend. Emotions keep us from taking the correct action.

Trump Trade Fading?
Over the last several weeks, I have been writing the 401k model needs to be adjusted up to 100% equity allocation. We still have a couple of the seasonally strong months of the year left ahead of us, and as noted above, the bullish trend remains intact.
The current consolidation in the market over the last few weeks, and the current risk/reward setup as noted above, is moving us toward an opportunity to incrementally increase exposure most likely in the next week or so.
As noted in the 401k-chart above, the current extension above the moving average has started to correct. The buy signals are beginning to contract and the deviation above the long-term average is being reduced. As long as the correction process is confined to a bullish trend, a short-term buy signal will allow for an increase in the model exposure.
WARNING: If you do not pay close attention to your 401-k plan, or are just more conservative, there is a substantial possibility that any increase in the model allocation could be reversed within a fairly short time frame.
The markets continue to hold together hoping for some movement on fiscal policy. However, the weak employment report on Friday may buy investors some time the slide in economic data may sideline the Fed from further rate hikes in June. This could be bullish for equities in the short term and we will likely know the market’s answer next week.
I did note four weeks ago, the run-up in interest rates HAD put bonds into a favorable position to add exposure in portfolios. That suggestion played out very favorably but with rates now back to short-term overbought condition, refrain from adding further fixed income holdings until the market bounces.
Current 401-k Allocation Model
The 401k plan allocation plan below follows the K.I.S.S. principal. By keeping the allocation extremely simplified it allows for better control of the allocation and a closer tracking to the benchmark objective over time. (If you want to make it more complicated you can, however, statistics show that simply adding more funds does not increase performance to any great degree.)
401k Choice Matching List
The list below shows sample 401k plan funds for each major category. In reality, the majority of funds all track their indices fairly closely. Therefore, if you don’t see your exact fund listed, look for a fund that is similar in nature.

Disclosure: The information contained in this article should not be construed as financial or investment advice on any subject matter. Streettalk Advisors, LLC expressly disclaims all liability in ...
more

