
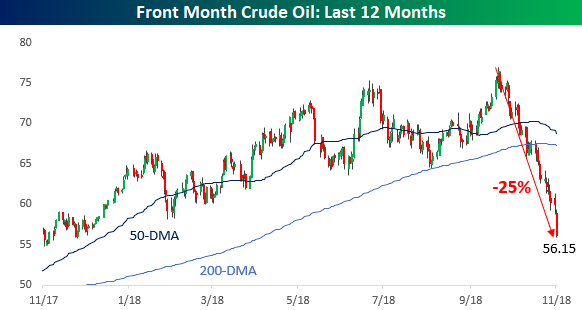
Oil Declining At Fastest Rate Since 2015 – 2016 Crash
With a record losing streak and the pace of declines picking up steam to the downside, the recent decline in crude oil prices is increasingly starting to resemble the bust we saw three years ago. With today’s decline, crude oil prices have now given up over 25% since the early October peak and are within $2 of a 52-week low. Furthermore, because the 52-week low was all the way back in last November, by the time we get to the end of the week, today’s prices will become the new 52-week low. That is unless we keep falling. Whatever happens from here, by this time next week the 52-week low in crude oil prices will shift from November 2017 to November 2018.
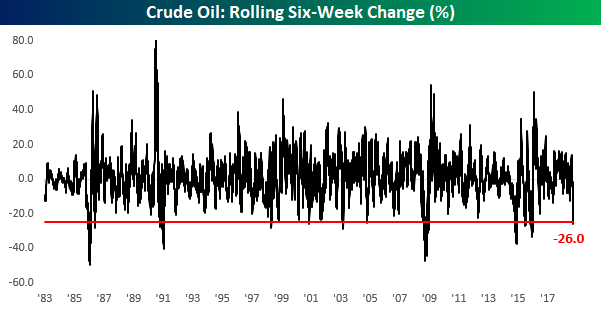
The fact that crude oil prices are down 25% 26% 27% in the last six weeks is notable due to the fact that it doesn’t happen all that often. As shown in the chart below, there have only been nine other periods going all the way back to 1983 where prices lost 25% or more of their value in 30 trading days with the last occurrence coming back during the crash in prices that spanned from mid-2014 through early 2016. Back then, the maximum decline over a six-week period was 37.5%.
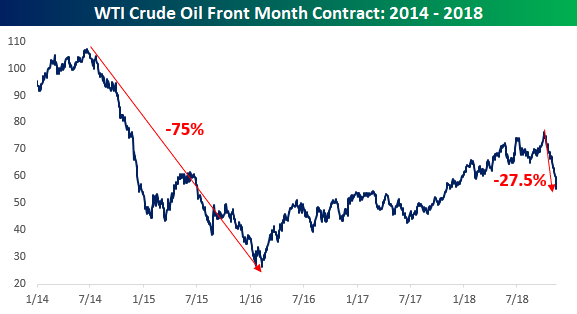
While the current decline is the most severe six-week drop we have seen since the 2015/2016 crash in prices, the important thing to keep in mind is that this drop hasn’t been nearly as long. As shown in the chart below, the current decline in prices has only spanned 29 trading days. Back in three years ago, oil prices lost three-quarters of their value over the span of 415 trading days.
Disclaimer: To begin receiving both our technical and fundamental analysis of the natural gas market on a daily basis, and view our various models breaking down weather by natural gas demand ...
more

