
No Holiday Cheer Yet, As Panic Mode Does Major Technical Damage Despite Attractive Valuations
Last week was the market’s worst since March. After Q3 had zero trading days with more than 1% move (up or down), our cup runeth over in Q4 with the stock rollercoaster so far offering up 22 days that saw a 1% move. Volatility seems rampant, but the CBOE Volatility Index (VIX) has not even eclipsed the 30 level during Q4 (whereas it hit 50 back in February). Even after Friday’s miserable day, the VIX closed at 23.23. Of course, the turbulence has been driven primarily by two big uncertainties: the trade dispute with China and the Federal Reserve’s interest rate policy, both of which have the potential to create substantial impacts on the global economy. As a result, investor psychology and the technical picture have negatively diverged from a still solid fundamental outlook.
For about a minute there, it seemed that both situations had been somewhat diffused, with Presidents Trump and Xi agreeing at the G20 summit to a temporary truce on further escalation in tariffs, while Fed chairman Powell made some comments about the fed funds rate being “just below” the elusive neutral rate. But investors’ cheers soon switched back to fears (soon to be tears?) with the latest round of news headlines (e.g., Huawei CFO arrest, Trump’s “Tariff Man” comment, Mueller indictments, and the imminent federal debt ceiling showdown). The uncertainty and fear-mongering led to a buyers’ strike that emboldened the short sellers, which in turn triggered forced selling in passive ETFs and automated liquidation in quant hedge funds, high-frequency trading (HFT) accounts, and leveraged institutional portfolios, which removed liquidity from the system (i.e., no bids), culminating in a retail investor panic. As it stands today, the charts look woefully weak and investor psychology has turned bearish, with selling into rallies rather than buying of dips.
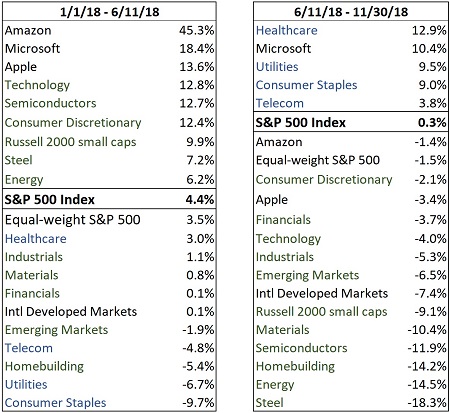
Ever since June 11, when the trade war with China escalated from rhetoric to reality, stocks have seen a dramatic risk-off defensive rotation, with Healthcare, Utilities, Consumer Staples, and Telecom the only sectors in positive territory and the only ones outperforming the broad S&P 500 Index. It’s as if investors see the strong GDP prints, the +20% corporate earnings growth (of which about half is organic and half attributable to the tax cut), record profitability, and record levels of consumer confidence and small business optimism as being “as good as it gets,” i.e., just a fleeting final gasp in a late-stage economy, rather than the start of a long-awaited boom cycle fueled by unprecedented fiscal stimulus and a still-supportive (albeit not dovish) Federal Reserve. As a result, forward P/E on the S&P 500 is down a whopping -19% this year, which is huge – especially considering this year’s stellar earnings reports and solid forward guidance.
But has anything really changed substantially with regard to expectations for corporate earnings and interest rates (the two most important factors) to so severely impact valuations? Not that I can see. And Sabrient’s quantitative rankings imply that the economy and forward guidance remain quite strong, such that the market is simply responding to the proverbial Wall of Worry by offering up a nice buying opportunity, particularly in beaten down cyclical sectors and in solid dividend payers – although there might be some more pain first. Over the past 10 years of rising stock prices since the Financial Crisis, there have been eight corrections of roughly -10% (including nearly -20% in 2011), and this year’s correction has led to the fourth major drawdown for Sabrient’s Baker’s Dozen annual top picks list (1Q2009, mid-2011, 2H2015, and now). But selling at each of those previous times would have been the wrong thing to do, and this time seems no different.
Market Commentary:
Starting on June 11 when the trade war with China escalated, a risk-off rotation set in, as capital moved out of small caps, emerging markets, international developed markets, and cyclical sectors (like Materials, Steel, Homebuilding, Energy, Industrials, Financials, and Semiconductors) and into US large-cap defensive sectors like Utilities, Healthcare, Telecom, and Consumer Staples, as well as (at least for a while) the mega-cap Technology names like Apple (AAPL), Amazon (AMZN), and Microsoft (MSFT) that dominate the cap-weighted market indexes. The accompanying table illustrates this pre- and post-June 11 behavior, through the end of November.
No doubt, there has been plenty of macro uncertainty to weigh on investor sentiment. First and foremost, of course, the two biggest have been: 1) the escalating trade war between the world’s two largest economies, and 2) the Federal Reserve seemingly hell-bent on raising rates and pulling liquidity out of the financial system without acknowledging the interdependent and highly-leveraged global economy – until recently, that is. In addition, there has been the mid-term elections, populist movements worldwide (including France’s violent Yellow Vest protests), the Mueller investigation, threats of impeachment, failing Brexit negotiations, Italy’s tenuous debt situation, deteriorating emerging market economies, China’s attempt at deleveraging as growth slows, an imminent battle in Congress over raising the debt ceiling and building “the wall,” and so on. All of this has served to increase investor concern about the sustainability of economic strength and where we are in economic cycle.
But lately, the negative headlines have been hitting the tape fast and furious. Within a few days of the Trump/Xi dinner, an announcement came out about the arrest of the CFO of Chinese conglomerate Huawei for violating sanctions against Iran. As for Trump (and his trusty sidekick Twitter), his latest negotiation approach is to proudly proclaim to be a “Tariff Man” – even while promising his willingness to sign any reasonable trade deal presented to him – as a veiled threat against a reeling Chinese economy that is struggling to maintain economic growth while deleveraging its massive debt (including its out-of-control “shadow banking” system) that has fueled its amazing growth rate. As for Powell, although he has talked in the past as if he is only concerned with US economic data in determining monetary policy, the reality is that the whole world feels the impact of rising US rates and a strengthening dollar, and this pain ultimately finds its way back home in an interdependent and highly-leveraged global economy – and he finally seems to be acknowledging such. The US economy indeed is “solid,” in his words, but not without risks on which wary investors have chosen to focus. Increasingly, commentators and investors are fearing the worst – an erosion in business confidence manifesting in reduced capital spending plans, a global recession commencing in 2019, and a bear market in stocks.
In April, Barry Bannister, head of institutional equity strategy at Stifel, predicted that hawkish Fed action could engender a rapid market decline from P/E compression – due to policy risks and not weak GDP – as the Fed overtly steps away from its long-standing “Fed Put” (in which it can be counted upon to prop up falling equity prices). Mr. Bannister thought it might result in a -16% P/E drop. And it appears he was quite right, as S&P 500 forward P/E is down about -19% by my calculation (from 18.5x to 15.0x). But because of the much stronger-than-expected corporate earnings reports and enormous share buybacks programs that have served to increase the denominator of the P/E equation, the numerator (i.e., price) hasn’t had to fall quite as far as it otherwise would have to hit -19% on P/E. Still, this is one of the three largest drops in forward P/E since 1991. Even in 2008, during the depths of the Financial Crisis and Great Recession, forward P/E only fell -18% (because earnings fell so precipitously). So, investor sentiment today seems completely out of line with the analyst community and corporate sentiment. It’s essentially pricing in an imminent recession and 5% Treasury yields. The question is whether analysts are on the verge of slashing estimates.
I similarly called for some P/E compression this year given the lofty (and speculative) forward P/E on the S&P 500 of 18.5x at the start of the year, but only to about 17x or so. But the magnitude of the compression has been exaggerated by the escalating trade battle with China and the unflinchingly hawkish rhetoric from the Fed. The S&P 500 started the year with an elevated forward P/E of about 18.5x to buy 11.5% expected year-over-year EPS growth, or a forward PEG of 1.6. Today, after the latest bout of volatility, the forward P/E sits at about 15.0x for expected EPS growth of about 15.2%, or a forward PEG (P/E divided by EPS growth) of slightly under 1.0, which is attractive. (Note: even FactSet’s “worst case” earnings for next year are still higher than this year’s and reflect a forward P/E of 15.5x.) But defensive sector Consumer Staples remains elevated at an 18.2x forward P/E to buy expected EPS growth of only 7.4%. Meanwhile, cyclicals have taken a major hit, with Homebuilders seeing their forward P/E falling from about 16x to around 10x, and Steel being cut in half, from 14x to about 7x (to buy 20% expected EPS growth, or a forward PEG of 0.35).
Nonetheless, there is no arguing with the current strength in the US economy, which is showing few outward signs of an imminent recession. Final Q2 GDP was a robust annual rate of 4.2%, and the BEA’s second estimate for Q3 (published on November 28) was 3.5%. Looking ahead, both the Atlanta Fed’s GDPNow model and the New York Fed’s Nowcast model as of December 7 forecast Q4 real GDP of 2.4%. The LEI rose to 124.54 in October, which is +2.66% YOY growth. Consumer spending is strong. The 10-year yield has fallen back below 3%, which supports equity valuations (both on a discounted cash flow basis and on a relative valuation basis versus bonds). In fact, the flattening yield curve poses more of a worry than the threat of out-of-control interest rates. Moreover, Q3 corporate earnings showed that nearly 80% of S&P 500 companies reported positive earnings surprises, and over 60% reported positive revenue surprises (including 92% of Technology companies).
Thus, it should come as no surprise that Sabrient’s growth-at-a-reasonable price (GARP) quantitative model, which aggregates the forward estimates of the many sell-side analysts who cover the universe of US-listed companies, suggests the economy still has legs and remains bullish on the cyclical sectors and small-and-mid-caps. The only reason that stocks shouldn’t be rising right now is if all of this good news is going to suddenly reverse, such as due to an escalating and protracted trade war, leading analysts to slash estimates across the board. But as things stand today, slightly lower but still-solid earnings momentum is hardly a reason for a market crash.
Still, extremely weak investor sentiment last week caused a rotation of capital out of stocks and into bonds such that the 10-year Treasury yield fell below the 3.0% level to close at 2.86%, while the 2-year closed Friday at 2.72%. So, the closely-watched 2-10 spread has plummeted to only 14 bps, which generates worries of a potential “Fed inversion” if the Fed keeps raising rates. But some market veterans prefer to watch the 3-month T-bill (2.40%) versus the 10-year T-note, which displays a less worrisome 46 bps spread. The FOMC meets next week, and another 25 bp hike is likely, according the fed funds futures, but the focus will be on the Jay Powell’s statement following the meeting and its connotation about the trajectory of future rate hikes.
The fed funds rate currently sits at 2.25% (top end of range), while PCE came in at only 2.0% (and core PCE 1.8%). TIPS spreads are at their lowest for the year and confirm that inflation is not a problem that needs containment (5-year spread suggests 1.7% inflation). Despite what you hear about the high levels of federal and corporate debt, net corporate debt (after accounting for cash balances) relative to GDP and federal debt servicing costs both remain within historical norms – so long as rates remain low. But as the fed fund rate approaches the elusive “neutral rate,” it is the first time in 10 years that markets will no longer enjoy the benefits of a stimulative monetary policy. This is not a small thing. Because even though it is true, as often opined by First Trust’s Brian Wesbury, that economic growth is mostly about entrepreneurship, innovation, corporate earnings, and fiscal policy (tax reform and deregulation), in my mind there is no refuting that monetary policy (ZIRP and QE) created a favorable investment environment characterized by low borrowing costs and abundant liquidity seeking higher returns, which fueled M&A, share buybacks, healthy balance sheets, and a stimulative “wealth effect” – although admittedly little in the way of the all-important corporate capital investment (i.e., for long-term things like new factories, technology upgrades, and hiring).
The reality is that it matters when the liquidity is pulled out of the system and interest rates rise on an indebted society. The cost of carrying debt becomes burdensome. For example, housing price inflation peaked late-summer as fixed-rate mortgages exceeded 5% and wage-to-mortgage ratios rose above recommended limits. The primary function of a central bank is to maintain some semblance of an even keel in the economy, moderating the magnitude of boom and bust cycles and preventing a destructive crash. The Fed’s current strategy is to nurture sustainable economic growth that can gradually replace the liquidity provided by the Fed so it can reduce its bloated balance sheet over time, but it can’t happen too fast without upsetting the applecart. In September, Jay Powell commented that the marketplace was telling him that fed funds was “near the neutral rate.” Then in October, he suggested that rates were “far from neutral.” But in November, he walked it back, saying that rates “remain just below the broad range of estimates of the level that would be neutral for the economy.” As a result, CME Group fed funds futures currently place the odds of a rate hike next week at 72%, but interestingly, there is now an 83% chance that there will be no more than one additional rate hike by the end of 2019 (i.e., a fed funds rate of 2.75% or less).
In closing, I will reiterate that I think investors have been presented with a nice buying opportunity, particularly in beaten down cyclical sectors and in solid dividend payers. But that’s not to say there won’t be some more pain first, as burned bulls watch for technical support and gather the conviction necessary to take the market higher. To summarize my outlook, which is based on what Sabrient’s GARP model is reflecting right now, the economy remains strong, unemployment is historically low, corporate earnings continue to beat expectations with solid guidance, corporate profitability sits at all-time highs, dividends are being increased, and corporate capital investment is finally kicking into gear after a lengthy dry spell (the fastest pace of growth in 25 years), while share buybacks are hitting all-time highs. This is all suggestive of a risk-on rotation, but for the moment, investors are behaving as if the good times won’t last much longer.
Indeed, we have seen glimpses of such a risk-on rotation, such as the relief rally after Fed chairman Powell’s more dovish words, as well as the risk-on performance spikes during the summer whenever China came to the negotiating table, and of course the rally immediately after the temporary truce was called. Each time, our portfolios gained back some ground against the benchmark. Our GARP model suggests that from a relative valuation standpoint, US cyclical sectors and small caps look quite attractive – and particularly if the Fed truly backs off its hawkish stance and the trade standoff with China finally finds some measure of resolution, leading companies to restate guidance higher and enticing risk capital back into the market.
Final comment: One notable observation of mine last week came courtesy of former President George H. W. Bush, whose funeral brought together all four living US presidents and their wives to sit next to each other, illustrating to the world (and to our own polarized citizenry) our ability to peacefully transfer power and unite as Americans for a common purpose. On that note, I think years from now, despite President Trump’s bellicose, irreverent, and polarizing language and behavior, his time as president may well be remembered for uniting Americans in recognizing China as our one true rival for global dominance (both economic and military) and confronting its long-standing practice of forced technology transfer, cyber espionage, and outright theft of cutting-edge technology (including military applications), which has been long ignored and enabled by decades of US Administrations, thus facilitating China’s rapid rise and its “Made in China 2025” aspiration for global dominance in high-tech manufacturing.
SPY Chart Review:
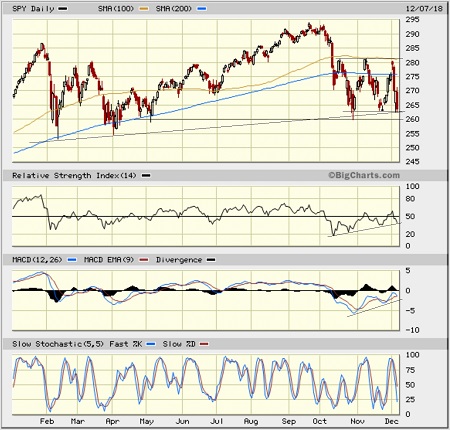
The SPDR S&P 500 ETF (SPY) closed Friday at 263.57 and seems to be either: 1) pounding out a triple bottom from which to launch a year-end recovery rally, or 2) getting ready to break down through important support at the full-year uptrend line as a “death cross” sets in (the 50-day simple moving average crossing down through the 200-day SMA). Ever since the mid-October correction, price has oscillated between resistance at the 100-day moving average around 282 and support around 263, where the full-year uptrend line is now converging. As oscillators RSI and MACD have cycled back down, they have been putting in higher lows, which is bullish; however, a retest of the October low at 260 may be in the cards. Notably, despite all the worrisome news and fear-mongers predicting an imminent recession, the SPY did not hit new lows for the year during all the Q4 turbulence. Although the technical picture does not look pretty, I don’t anticipate a major selloff from here, although a retest of the April or February lows can’t be ruled out given the horrid investor sentiment.
Latest Sector Rankings:
Relative sector rankings are based on our proprietary SectorCast model, which builds a composite profile of each of over 600 equity ETFs based on bottom-up aggregate scoring of the constituent stocks. The Outlook Score employs a forward-looking, fundamentals-based multifactor algorithm considering forward valuation, historical and projected earnings growth, the dynamics of Wall Street analysts’ consensus earnings estimates and recent revisions (up or down), quality and sustainability of reported earnings, and various return ratios. It helps us predict relative performance over the next 1-3 months.
In addition, SectorCast computes a Bull Score and Bear Score for each ETF based on recent price behavior of the constituent stocks on particularly strong and weak market days. A high Bull score indicates that stocks within the ETF recently have tended toward relative outperformance when the market is strong, while a high Bear score indicates that stocks within the ETF have tended to hold up relatively well (i.e., safe havens) when the market is weak.
Outlook score is forward-looking while Bull and Bear are backward-looking. As a group, these three scores can be helpful for positioning a portfolio for a given set of anticipated market conditions. Of course, each ETF holds a unique portfolio of stocks and position weights, so the sectors represented will score differently depending upon which set of ETFs is used. We use the iShares that represent the ten major U.S. business sectors: Financial (IYF), Technology (IYW), Industrial (IYJ), Healthcare (IYH), Consumer Goods (IYK), Consumer Services (IYC), Energy (IYE), Basic Materials (IYM), Telecommunications (IYZ), and Utilities (IDU). Whereas the Select Sector SPDRs only contain stocks from the S&P 500 large cap index, I prefer the iShares for their larger universe and broader diversity.
Here are some of my observations on this week’s scores:
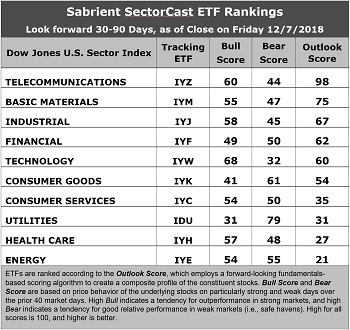
1. Defensive sector Telecom continues to hold the top spot with a strong Outlook score of 98. Telecom displays an attractive forward P/E of 13.6x, the highest return ratios, good insider sentiment (insider buying activity), and the best sell-side analyst sentiment (net positive revisions to EPS estimates). However, its pure GARP metrics are only average, with projected year-over-year EPS growth rate of only 9.0% and a forward PEG (ratio of forward P/E to forward EPS growth rate) of 1.51, which ranks it only 7th out of 10 sectors on PEG (this is why we don’t see many Telecoms as candidates for Sabrient’s GARP portfolios). Basic Materials takes second with an Outlook score of 75, as it displays an attractive forward P/E that has fallen to 12.6x and decent sell-side analyst sentiment, plus a low forward PEG of 1.05. Industrial has moved into third and displays strong analyst and insider sentiment and a forward PEG of 1.10. Financial and Technology round out the top five.
2. At the bottom of the rankings we find Energy and Healthcare. Energy has received a lot of downward earnings revisions (as oil prices have fallen), and its return ratios are weak, although it also displays the strongest projected EPS growth rate of 49% and the lowest forward PEG of 0.31 (which is why you typically will see Energy names in Sabrient’s GARP portfolios). Healthcare displays an elevated forward P/E (16.3x) and poor return ratios.
3. Looking at the Bull scores, Technology enjoys the top score of 68, followed by defensive sector Telecom at 60, as stocks within these sectors have displayed relative strength on strong market days. Utilities scores the lowest at 31, followed by Consumer Goods (Staples/Noncyclicals) at 41. The top-bottom spread is quite wide at 37 points, which reflects quite low sector correlations on strong market days. It is desirable in a healthy market to see low correlations reflected in a top-bottom spread of at least 20 points, which indicates that investors have clear preferences in the market segments and stocks they want to hold (rather than broad risk-on behavior).
4. Looking at the Bear scores, as usual we find Utilities alone in the top spot with a score of 79, followed by Consumer Goods (Staples/Noncyclical) at 61, which means that stocks within these defensive sectors have been the preferred safe havens lately on weak market days. Technology has by far the lowest score of 32, as investors have fled during recent market weakness, largely due to a massive repricing among the mega-cap Tech names (especially Apple). The top-bottom spread is 47 points, which reflects quite low sector correlations on weak market days. Ideally, certain sectors will hold up relatively well while others are selling off (rather than broad risk-off behavior), so it is desirable in a healthy market to see low correlations reflected in a top-bottom spread of at least 20 points.
5. Telecom displays the best all-around combination of Outlook/Bull/Bear scores, followed by Materials, while Energy is the worst. Looking at just the Bull/Bear combination, Utilities is the best, but it relies primarily on its Bear score, while Energy is the best from the standpoint of its balanced Bull and Bear scores, indicating superior relative performance (on average) in extreme market conditions (whether bullish or bearish). Financial scores the worst.
6. This week’s fundamentals-based Outlook rankings still reflect a bullish bias, given that four of the top five sectors are economically-sensitive (cyclical), and all of them score above 60. It remains a bit concerning that Telecom has remained at the top, when I expected it to be a temporary phenomenon. Keep in mind, the Outlook Rank does not include timing, momentum, or relative strength factors, but rather reflects the consensus fundamental expectations at a given point in time for individual stocks, aggregated by sector.
ETF Trading Ideas:
Our Sector Rotation model, which appropriately weights Outlook, Bull, and Bear scores in accordance with the overall market’s prevailing trend (bullish, neutral, or defensive), now displays a defensive bias and suggests holding traditionally defensive Utilities (IDU), Consumer Goods (Staples/Noncyclical) (IYK), and Telecom (IYZ), in that order. (Note: In this model, we consider the bias to be defensive from a rules-based trend-following standpoint when SPY moves below both its 50-day and 200-day simple moving averages.)
Besides iShares’ IDU, IYK, and IYZ, other highly-ranked ETFs in our SectorCast model (which scores nearly 500 US-listed equity ETFs) from the Utilities, Consumer Staples, and Telecom sectors include First Trust Utilities AlphaDEX Fund (FXU), First Trust Consumer Staples AlphaDEX (FXG), and Fidelity MSCI Telecommunications Services (FCOM).
If you prefer a bullish bias (which might be warranted by the extremely oversold conditions and still-solid fundamentals), the Sector Rotation model suggests holding Telecom, Technology, and Industrials, in that order. On the other hand, if you are more comfortable with a neutral stance on the market, the model suggests holding Telecom, Basic Materials, and Industrial, in that order.
An assortment of other interesting ETFs that are scoring well in our latest rankings include SPDR S&P Transportation (XTN), US Global Jets (JETS), VanEck Vectors Mortgage REIT Income (MORT), First Trust NASDAQ Bank (FTXO), Alpha Architect US Quantitative Value (QVAL), SPDR S&P 500 Buyback (SPYB), FLAG-Forensic AccountingLong-Short (FLAG), iShares US Financial Services (IYG).
Disclosure: The author has no positions in stocks or ETFs mentioned.
Disclaimer: This newsletter is published solely for informational purposes and is not to be construed as advice or a ...
more


Panic is out.