
Net Vs. Gross Investment
Deregulatory moves, both actual and anticipated, have been hailed as spurring business fixed investment. Is there content to this assertion? A glance at nonresidential fixed investment seems to be supportive.
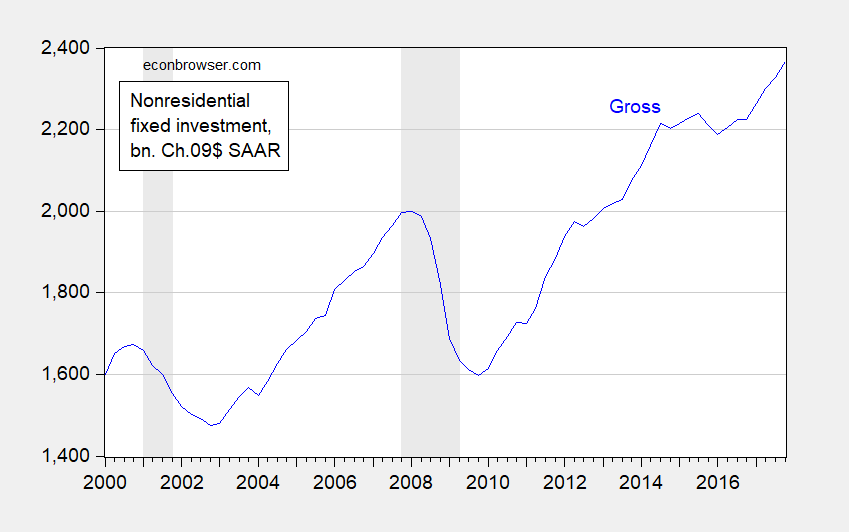
Figure 1: Private nonresidential fixed investment, in billions of Ch.2009$, SAAR (blue). NBER defined recession dates shaded gray. Source: BEA, 2017Q4 3rd release.
However, the standard investment series reported in the NIPA tables pertain to gross investment spending, i.e., not taking into account depreciation. As capital expenditures have skewed more toward information and communication technology (ICT) equipment and software, the pace of capital depreciation has accelerated. As a consequence, the net and gross series have deviated more profoundly over time. Plotting net investment and gross investment (on a log scale) provides a fairly surprising picture.
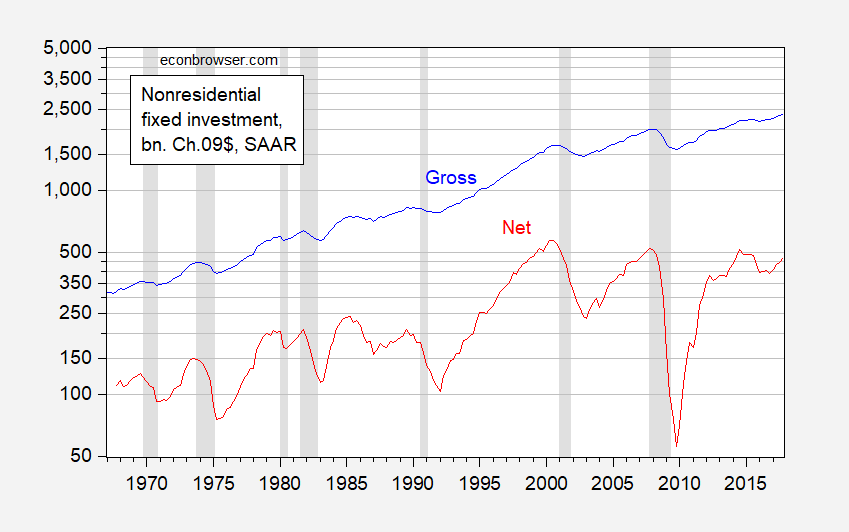
Figure 2: Private gross nonresidential fixed investment (blue), and private net nonresidential fixed investment (red), both in billions of Ch.2009$, SAAR, both on a log scale. NBER defined recession dates shaded gray. Net figures calculated by subtracting depreciation from gross. Quarterly figures linearly interpolated from end-of-year annual data. 2017 depreciation values extrapolated from 2016Q4 rates. Source: BEA, 2017Q4 3rd release, annual fixed asset tables, and author’s calculations.
The figure makes clear, despite the recent acceleration in investment, net investment has not re-attained levels achieved in 2014Q3 (let alone on the eve of the last recession).
Moreover, because GDP has grown over time, the (log) ratio of investment to GDP has declined. The same is true for log(I/K). [Note: I don’t show I/K or I/GDP because all series expressed in Chained dollars, and ratios of such are not meaningful.)
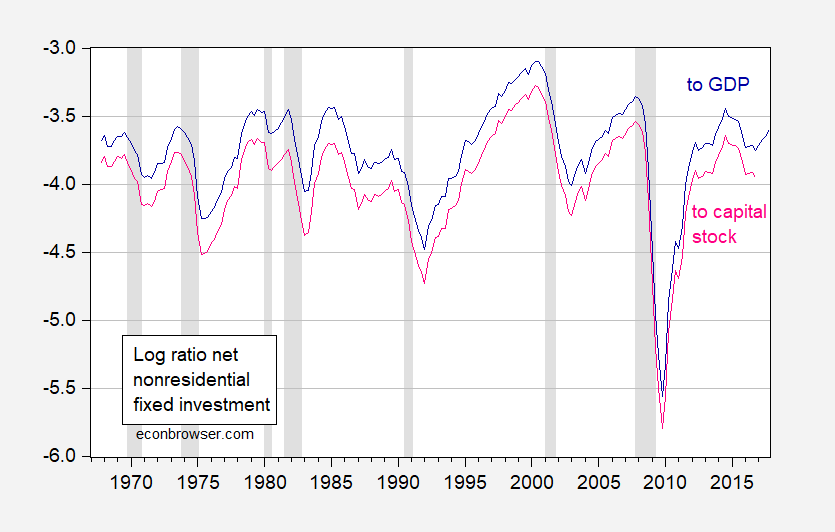
Figure 3: Log ratio of private net nonresidential fixed investment to GDP (dark blue), and to private nonresidential capital stock (pink). NBER defined recession dates shaded gray. Net figures calculated by subtracting depreciation from gross. Quarterly figures linearly interpolated from end-of-year annual data. 2017 depreciation values extrapolated from 2016Q4 rates. Source: BEA, 2017Q4 3rd release, annual fixed asset tables, and author’s calculations.
Investment is low at a time when real interest rates remain quite low, stock market valuations (and hence Tobin’s q) remain high, corporate profits large. And, interestingly, over the past year, with economic policy uncertainty as measured by Baker, Bloom and Davis, at elevated levels, investment has accelerated relative to 2016. (Discussion of whether uncertainty affected investment in this post.)
So, too soon to declare an investment boom. It may be that Kudlow’s prediction for a post tax-cut boom will come to pass, but there’s a long way to go to have a resurgence in net terms.
Disclosure: None.


