
Janet Yellen's Ptolemaic Monetary Universe
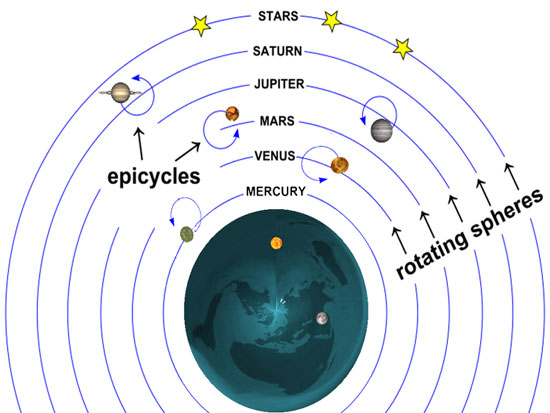
For more than 2,000 years leading thinkers believed that the sun, moon, planets and stars revolved around the earth, which, in turn, stood at the very center of the universe. But even then observations didn't always square with the model, so the so-called Ptolemaic epicycles and work-arounds were invented to explain the deviations.
At length, the whole thing collapsed when Copernicus demonstrated that the earth is not the center of the universe at all. Indeed, that its true station in the great scheme of things was the far more humble one of rotating with all the other planets around the sun.
And so even now we wait for our monetary Copernicus to show up and to call fake on the utterly flawed model of our Keynesian central bankers. They are as wrong about the place of central banking in the great scheme of economics as were the ancients about the place of the earth in the universe.
Even though the ancients were trapped in fundamental intellectual errors, you can say this much for them: They never attempted to run the universe----only to describe it.
Not so our central bankers. They are both dead wrong and deadly agents of destructive intrusion into the clockwork of capitalism.
They arrogantly presume to be improving upon the latter and, so doing, recognize no restraints whatsoever on their right to meddle and manipulate the central mainspring, financial asset prices, of capitalist prosperity. Yet the core tenets upon which these interventions are predicated are demonstrably untrue, as is being made evident by steadily deteriorating macroeconomic performance in the face of radically increasing applications of central banking goodness.
As we noted yesterday, it took the first 88 years of the Fed's existence (1914-2002) to reach $600 billion of balance sheet girth, but only 15 years since then to balloon seven-fold to $4.4 trillion. That explosion of bond-buying, something utterly inexplicable as recently as 1995, had the explicit purpose of driving down interest rates and lifting the price of equities and other risk assets on the theory that the macro performance can be improved through the steering gear of financial asset prices.
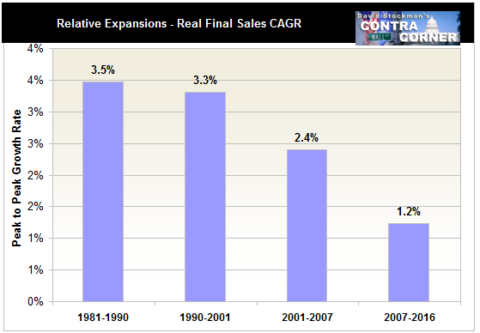
Self-evidently, it can't and hasn't. Since central bank balance sheets and financial market intrusions went parabolic at the turn of the century, the trend rate of US economic performance has been sinking like a stone.
We found it necessary to dust off the above chart after listening to Janet Yellen's incoherent babbling at Wednesday's post-meeting presser. To hear our Keynesian schoolmarm tell it, you would think we have arrived at the Keynesian nirvana of full-employment, rising real incomes and record Main Street prosperity.
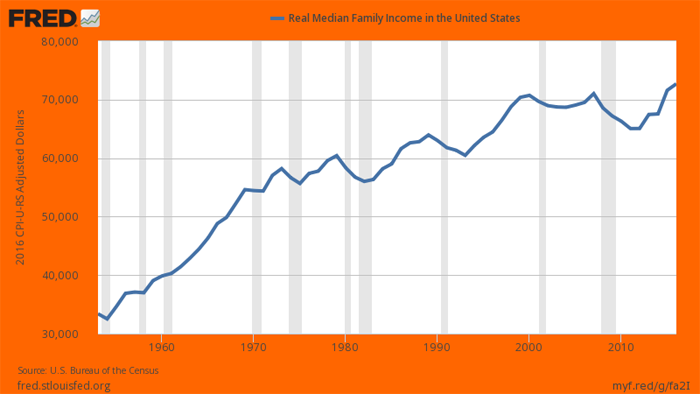
To the contrary, the real living standards of Flyover America have gone nowhere since the turn of the century, and have actually deteriorated when you give consideration to an honest measure of inflation. Indeed, even under the short-ruler used by the BLS, real median family incomes in 2016 were only a tad higher than in 1999.
In earlier times that fact would have been considered tantamount to a crisis---not evidence that all is awesome and that the monetary policy ministrations of the Eccles Building are "working". In fact, the long-term trend deterioration is so strikingly clear that you would not be remiss in thinking that Yellen & Co inhabit some alternative universe.
To wit, during the long period (33 years) between 1954 and 1987, real median family incomes grew at a 2.0% annual rate. During this period there were two reasonably great Fed chairmen, William McChesney Martin and Paul Volcker. Even the dunderheads, Arthur Burns and William Miller, had a decent respect for the integrity of the financial markets, even if they did put too heavy a foot on the credit growth accelerator.
By contrast, during the next 13 years, Alan Greenspan invented Bubble Finance when he bailed out Wall Street after the stock market crash of October 1987, the bond market turmoil of 1994 and the Long Term Capital fiasco of 1998. In all, the Fed's furious money pumping produced a stock market boom----with the S&P 500 rising at a 10.2% real rate during the period.
On the other hand, the growth rate of real median family income plunged to half its historic rate, rising by only 0.94% between 1987 and the year 2000. That is, stock prices rose 11X faster in real terms that middle class incomes.
Needless to say, Greenspan had become the toast of the town in both Washington and Wall Street during that interval, and was not about to allow the dotcom crash of 2000 to negate his power and glory. So he pulled out all the stops, dropping the Federal funds rate for 30 months in a row between December 2000 and June 2003, bringing a 6.25% cost of overnight money down to an unheard of 1.00%.
That did cause the credit and mortgage markets to boom, which, in turn, gestated the massive housing bubble that eventually ended in the great financial crisis of September 2008. Thereafter, of course, Greenspan's successors and assigns pulled out all the monetary stops.
The result: 16 years of Nowheresville for the average US family. The growth rate of real median family income for that period was a rounding error at 0.17% per year, as reported by the official agencies, and surely has a negative sign when deflated by an honest measure of inflation.
Did Greenspan, Bernanke and now Yellen ever even remotely acknowledge this thundering failure?
Or, in the alternative, have they ever explained why it would have been even worse without a $4 trillion or 8X expansion of the Fed's balance sheet since 2000? That is, exactly what toxic ether was blown-in on a comet from outer space that caused this fundamental measure of capitalist prosperity to drop by 92 percent---from 2.00% per annum to 0.17%.
To the contrary, they have merely invented a new narrative---one that ignores history entirely, measures change by selectively cherry-picking from the "incoming" monthly data noise and that essentially calls failure a success.
Not surprisingly, the Fed heads almost never talk about productivity, breadwinner jobs, net real capital investment or even industrial production. Their entire focus is on two artifacts, "the labor market" as depicted in the BLS monthly establishment survey and the "inflation" rate as measured by the PCE deflator.
As we will remind once again below, both of these metrics are essentially irrelevant noise. But first consider why living standards in Flyover America have been dead in the water during this century.
One of the remarkable delusions of the present era is that anyone takes the BLS establishment survey seriously or that even our lightweight politicians on Capitol Hill keep appropriating money to fund it. After all, when you add $9 per hour gigs at McDonald's averaging ten hours per week on the pay clock, you get an annual earnings rate of $4,680.
By contrast, average earnings in the information technology sector was $38.34 per hour last month and clock time averaged about 1900 hours on an annualized basis. That computes to $72,350 annually or 15.5X more.
And that's not the half of it. It turns out that since the turn of the century, while part-time jobs in the bar and restaurant trade have soared, the number of full pay jobs in the information technology sector has plunged by 25%, dropping from 3.7 million in the year 2000 to just 2.7 million at present.
EMPLOYEES, THOUSANDS: Information Technology and Communications

So how can you add the numbers from the above picture with those from the bread and circuses sector shown below?
Stated differently, based on the value of labor content per job, the 4.2 million bartender and waiter jobs gained since 2000 generate about $80 billion per year of labor content. But that barely exceeds the $73 billion of annual labor content lost since the year 2000 owing to 1.0 million fewer jobs in the information technology sector, which includes publishing, motion pictures, broadcasting, telecommunications, data processing and other information services.
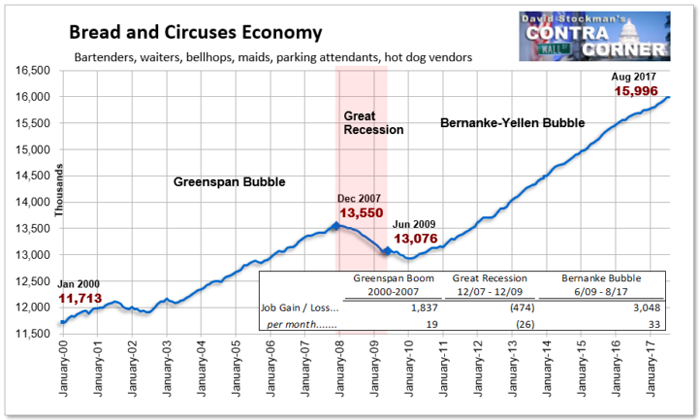
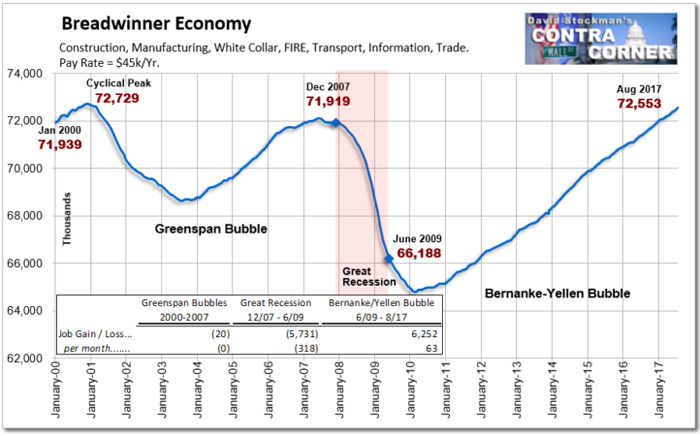
So the notion that the labor market is "improving" positively cannot be divined from the aggregate BLS data, and the Fed heads never do talk about what is actually happening to the composition down below. After all, if they did the would have to admit what the following graph makes abundantly clear.
Namely, that the $4 trillion expansion of the Fed's balance sheet since 2000 has not generated on a net basis a single full-time, full pay "breadwinner" job in the American economy.
Needless to say, if you are not generating breadwinner jobs then the only other avenue for rising incomes would be rising productivity and pay. But that isn't happening, either.
Since eve of the 2008 financial crisis, productivity gains have averaged just 0.55% per annum and about 1.5% since the turn of the century, including the two post-recession cyclical rebounds.
By contrast, during the 1954-1987 period that annual gain was 2.2%. Yet not withstanding endless jabbering by Yellen and the post-meeting statements about "labor market" conditions, we can not recall one mention of productivity trends, let alone a serious addressing of why they have been heading south in such undeniable fashion.
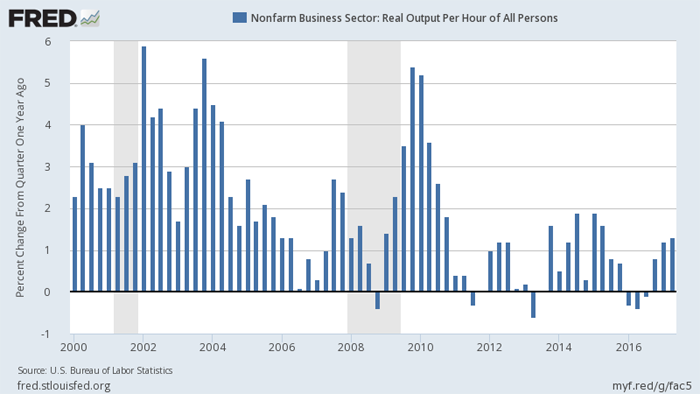
Needless to say, there is one data chart in this regard that the Fed studiously avoids, even though it shows exactly why productivity of American labor is deteriorating so badly.
To wit, the Fed's drastic falsification of financial asset prices has turned the C-suites of corporate American into financial engineering operations. As shown below, stock buybacks and M&A deals have lead to the liquidation of more than $4 trillion of corporate equity since the turn of the century. And not just on an episodic or cyclical basis, but year after year without interruption.
When CB's Falsify Debt Prices Here's What Happens------$4 Trillion of Corporate Equity Liquidated Since 2000
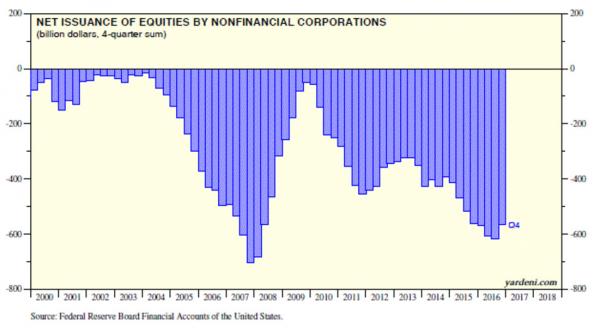
Consequently, US companies have massively shifted their focus from capital investment on the factory floor, store interior or office operations to pumping their cash flow and balance sheet capacity back into Wall Street in order to goose their share prices and stock options.
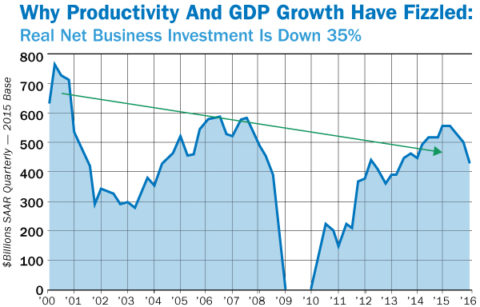
Indeed, even as the corporate sector has flushed more than $15 trillion back into Wall Street since 2005 to fund M&A deals, share buybacks, unearned dividends and LBOs, actual real net investment (after current year depreciation of capital used in production) is down 35% from turn of the century levels.
Actually, After Capital Consumption, Real Business Investment Is Down 35%
This gets us to the Fed's Ptolemaic model of the economy. The actual economy of the US and world consists of billions of wages and prices and dynamically moving labor, capital and material resources that cannot be captured in quantitative macroeconomic models. Period.
In part, that's because even basic elements like labor and inflation are poorly measured by the government statistical mills, as we have demonstrated above in the case of a metric called "jobs".
Nevertheless, our Keynesian central bankers continue to insist that the macroeconomy can be reduced to a purely quantitative flow model that resembles a giant bathtub. In that context, the mandate of the central bank is to insure that it is filled to the brim of "full employment" and "potential GDP", and that this can be accomplished by pegging and goosing financial asset prices.
The resulting regime of sub-market interest rates, repressed cap rates and inflated risk asset prices, in turn, is supposed to drive inflation to a magic target of 2.00% and vacate every ounce of labor "slack" from the bathtub. In essence, that's how Yellen justified keeping interest rates at 1.125% after 100 months of business cycle recovery.
At our meeting that concluded earlier today, my colleagues and I on the Federal Open Market Committee decided to maintain the target range for the federal funds rate at 1 to 1.25 percent. This accommodative policy should support some further strengthening in the job market and return to 2 percent inflation consistent with our statutory objectives.
Here's the thing. There is absolutely no evidence that 2.00% inflation has anything to do with sustainable prosperity. Instead, apparently, in the Ptolemaic monetary universe it is only a token marker for determining when the imaginary bathtub of GDP is filled to the brim.
By contrast, there is much evidence---as we will demonstrate in another post----that the Fed's inflation fixation is the equivalent of a Ptolemaic epicycle; it is a specious explanation for why observed reality doesn't conform to the Keynesian models of our ruling central bankers.
In language the ancient would understand, it amounts to no more than a ritual incantation used to justify central bank activism in behalf of an erroneous model of the economic world.
But the Keynesian model error is not nearly so innocent as that of the Ptolemaics. With even BLS style inflation running close to 2%, it is evident that the Fed is presiding over a noxious regime of negative real interest rates in the money markets. That is, the central bank itself is the source of endless carry trade speculation and the hideous inflation of financial asset prices which has resulted from it.
Yet like in the case of the Ptolemaics, the obvious refutation of the model and its epicycles is easy to find, and out friend Mish Shedlock did a great job of pointing it out in a recent post. Namely, just look at the weightings in the CPI and ask just which of these components results in deferred consumption and economic performance shortfalls because people as immobilized waiting for lower prices.
The whole deflation bogeyman, in fact, is today's epicycle equivalent. Here is how Mish explained it:
One can find thousands of such references, all of them idiotic. Let’s prove that with a single picture and a few comments.
CPI Percentage Weights
The idea behind inflation expectations is that if consumers think prices will go down, they will hold off purchases and the economy will collapse. The corollary is that is consumers think inflation will rise, they will rush out and buy things causing the economy to overheat.
With that backdrop, let’s have a Q&A. I believe the answers are obvious in all cases.
Inflation Expectations Q&A
Q: If consumers think the price of food will drop, will they stop eating out?
Q: If consumers think the price of food will drop, will they stop eating at home?
Q: If consumers think the price of natural gas will drop, will they stop heating their homes and stop cooking to wait for the event.
Q: If consumers think the price of gas will drop, will they stop driving or not fill up their car if it is running on empty?
Q: If consumers think the price of gas will rise, can they do anything about it other than fill up their tank more frequently?
Q: If consumers think the price of rent will drop, will they hold off renting until that happens?
Q: If consumers think the price of rent will rise, will they rent two apartments to take advantage?
Q: If consumers think the price of plane tickets, taxis, and bus tickets will drop, will they hold off taking the plane the train or the bus?
Q: If consumers think the price of plane tickets, taxis, and bus tickets will rise, will they rush out and buy multiple tickets driving the prices even higher up?
Q: If people need an operation, will they hold off if they think prices might drop next month?
Q: If people need an operation, will they have two operations if they expect the price will go up?All of the above questions represent inelastic items. Those constitute 80.254% of the CPI. Commodities other than food and energy constitute the remaining 19.746% of the CPI. Let’s hone in on that portion with additional Q&A.
Q. If someone needs a refrigerator, toaster, stove or a toilet because it broke, will they wait two months if for some reason they think prices will decline?
Q. If someone does not need a refrigerator, toaster, stove or a toilet will they buy one anyway if they think prices will jump?
Q. The prices of TVs and electronics drop consistently. Better deals are always around the corner. Does that stop people from buying TVs and electronics?
Q. If people thought the price of TVs was about to jump, would they buy multiple TVs to take advantage?For sure, some people will wait for year-end clearances to buy cars, but most don’t. And if a car breaks down, consumers will fix it immediately, they will not wait for specials.
Stupidity Well Anchored
The only thing that’s “well anchored” is the stupidity of the belief that inflation expectations matter.

Disclosure: None.


