Is Market Breadth Confirming The Stock Market’s Recent Highs?
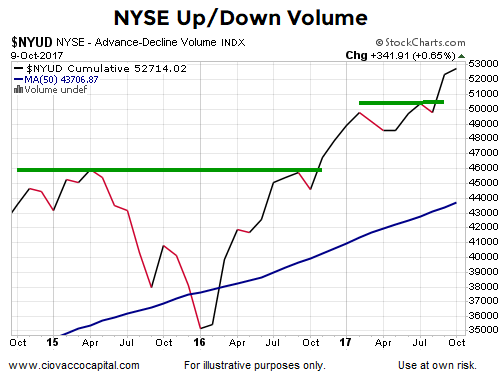
Volume-Based Breadth Indicator
The monthly chart below shows the NYSE’s volume associated with advancing issues minus volume associated with declining issues. As of October 9, 2017, the indicator has been making new highs along with the market.

Fact or Fiction?
This week’s stock market video water tests three widely held beliefs about bull and bear markets, including:
Stocks have been going up for over eight years, which means a major bull market peak is coming soon.
After you click play, use the button in the lower-right corner of the video player to view in full-screen mode. Hit Esc to exit full-screen mode.
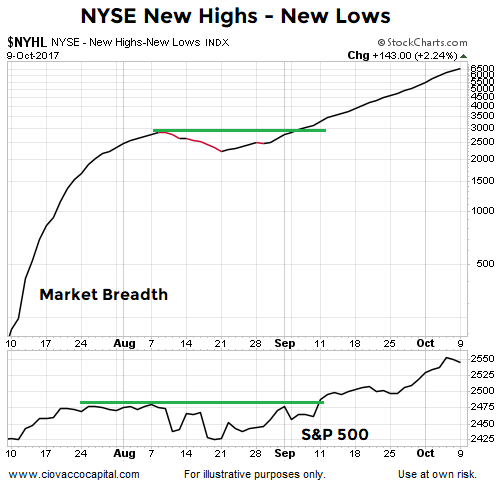
New Highs - New Lows
The chart below shows the number of NYSE advancing issues minus declining issues. The indicator has been making new highs along with the major indexes. There are no yellow flags as of October 9, 2017.

Disclaimer: The opinions in this document are for informational and educational purposes only and should not be construed as a recommendation to buy or sell the stocks mentioned or to solicit ...
more


