
There Is Always A Bull Market Somewhere: Sector Rotation
Successful investing is not just about picking the best individual names in a particular sector or industry. Selecting the right areas of the market to invest in can be even more important in terms of maximizing returns and controlling downside risk.
When stocks in a particular industry are booming, even a mediocre company in such industry can deliver generous gains. Conversely, when an industry is facing strong headwinds, chances are that most individual stocks in such industry will also suffer heavy losses.
Positioning your portfolio in the best industries and sectors at the right time can make a huge difference on returns, especially if you are looking to control downside risk during bear markets.
There is plenty of research indicating that investors can outperform a buy and hold strategy in the long term by implementing quantitative trading strategies based on trend following and relative strength
Trend following basically means that you only invest in a particular sector when such sector is in an uptrend. A typical long-term trend measure is the 200 day moving average of prices, so a market sector or industry can be considered in an uptrend when prices are above such moving average and viceversa.
Relative strength is about comparing different sectors. Even if technology and consumer discretionary stocks are both in uptrends, we can compare the two sectors in terms of their risk-adjusted returns to evaluate which one has superior relative strength.
In plain English, combining trend following and relative strengths means that we are looking to invest only in sectors and industries that are rising in price over the long term, and we are also looking for the strongest areas of the market among the ones that are rising in price.
System Implementation
The sector rotation system has an investable universe consisting of 25 ETFs that represent different sectors and industries.
These are:
- First Trust Dow Jones Internet Index (FDN)
- iShares Nasdaq Biotechnology ETF (IBB)
- iShares U.S. Oil Equipment & Services (IEZ)
- iShares North American Tech-Software (IGV)
- iShares U.S. Pharmaceuticals ETF (IHE)
- iShares U.S. Healthcare Providers (IHF)
- iShares U.S. Medical Devices ETF (IHI)
- iShares U.S. Aerospace & Defense (ITA)
- iShares U.S. Home Construction ETF (ITB)
- iShares US Industrials ETF (IYJ)
- iShares Transportation Average ETF (IYT)
- iShares US Technology ETF (IYW)
- iShares US Telecommunications ETF (IYZ)
- SPDR S&P Bank ETF (KBE)
- SPDR S&P Capital Markets ETF (KCE)
- SPDR S&P Insurance ETF (KIE)
- Invesco Dynamic Food & Beverage ETF (PBJ)
- Invesco Dynamic Media ETF (PBS)
- VanEck Vectors Semiconductor ETF (SMH)
- Vanguard REIT ETF (VNQ)
- Materials Select Sector SPDR Fund (XLB)
- Consumer Staples Select Sector SPDR (XLP)
- Utilities Select Sector SPDR Fund (XLU)
- SPDR Series Trust S&P Oil & Gas Exploration (XOP)
- SPDR Series Trust S&P Retail ETF (XRT)
In order to be eligible an ETF has to be in an uptrend, meaning that the current market price is above the 10-month moving average. If no ETF is in an uptrend, that capital is allocated to a low risk ETF, which in this case is the Barclays Low Duration Treasury (SHY)
Among the ETFs that are in an uptrend, the system buys the top 5 with the highest relative strength. Relative strength is measured by a ranking system that considers total returns over 3 months and 6 months, and it includes volatility as a negative factor.
A 10% increase over 6 months can be a huge bull market for an ETF with low volatility, and it can also be an average gain for a more volatile instrument. This means that we need to consider volatility levels when comparing relative strength, so the system is based on volatility-adjusted returns as opposed to standalone return figures.
The ETF portfolio is rebalanced monthly, and the benchmark is the SPDR S&P 500 ETF
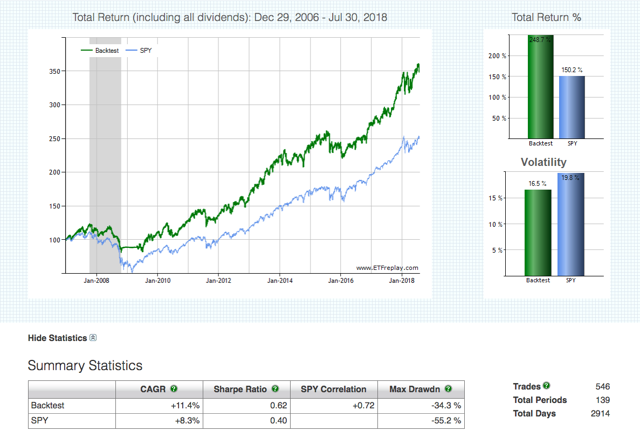
Data source: ETFReplay.
Backtested performance numbers are quite strong. Since January of 2007 the system gained 11.4% per year versus 8.3% annually for the market-tracking ETF. In cumulative terms, the system gained 248.7% versus 150.2% for the benchmark.
Perhaps more important, the system is stronger than the benchmark in terms of risk metrics too, since the system has both a lower volatility level and a smaller maximum drawdown.
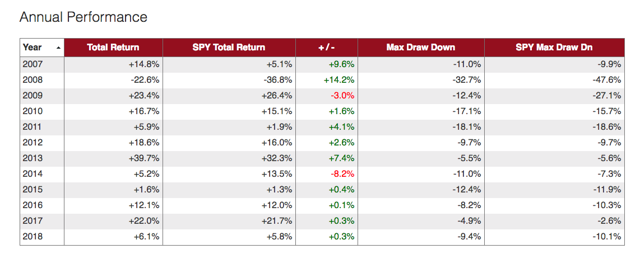
Offering more details, the table below shows performance statistics for the quantitative system and the benchmark over the past several years.
Data source ETFReplay
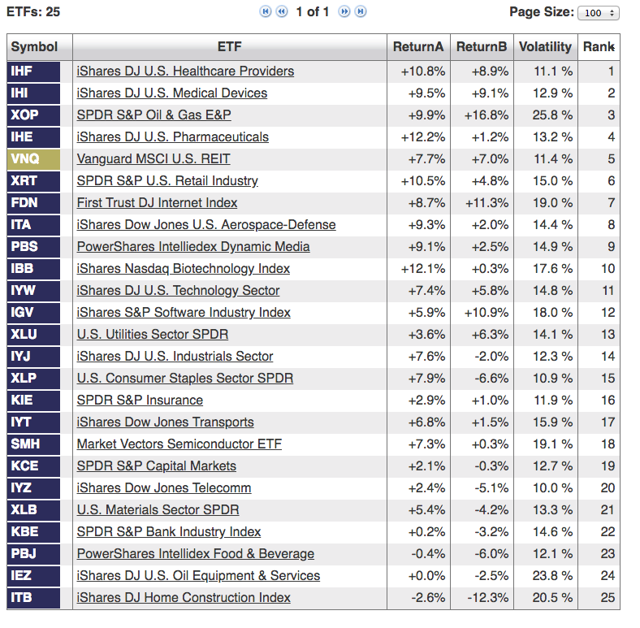
The table has the relative strength rankings for the 25 ETFs in the investable universe.
No system is perfect or infallible. Momentum tends to work particularly well in some time periods, but a strategy based on momentum investing can certainly under-perform over long periods of time. Especially in times of market reversals, momentum strategies can be quite volatile.
That being acknowledged, the main point is that investing in different sectors and industries based on combination of trend-following and relative strengths tends to produce superior risk adjusted returns over the long term.
Importantly, these kinds of systems are not only for investors who trade ETFs based on quantitative indicators. The system can provide enormously valuable information in terms of evaluating the overall market environment and positioning your portfolio accordingly. It makes a lot of sense to analyze price trends and relative strength in different areas of the market when building a diversified portfolio of stocks in different sectors and industries.
Information is power, and a quantitative system such as this one can offer valuable information about the main relative strength and weakness in different industries and sectors.
Capitalize on the power of data and technology to take the guesswork out of your investment decisions. Statistical research has proven that stocks and ETFs showing certain quantitative attributes tend to outperform the market over the long term. A subscription to The Data Driven Investor provides you access to profitable screeners and live portfolios based on these effective and time-proven return drivers. Forget about opinions and speculation, investing decisions based on cold hard quantitative data can provide you superior returns with lower risk. Click here to get your free trial now.
Disclaimer: I wrote this article myself, and it expresses my own opinions. I am not receiving compensation for it. I have no business relationship with any company whose stock is mentioned in ...
more

