
Bitcoin Finds Strong Support, But Will It Hold?
- Bitcoin made a potential major low on December 22 at $11,179.30 (source: Optuma).
- This low corresponds to four preceding important lows starting from the low of March 27, 2018 and therefore has a good chance of holding.
- Even though a key low may have been put in, geometric analysis indicates caution in the near-term as the outlined correction area extends into the next few weeks.
Let’s start by updating this rather successful identification of a low on this daily cumulative average chart from our weekly report dated December 3, 2017:
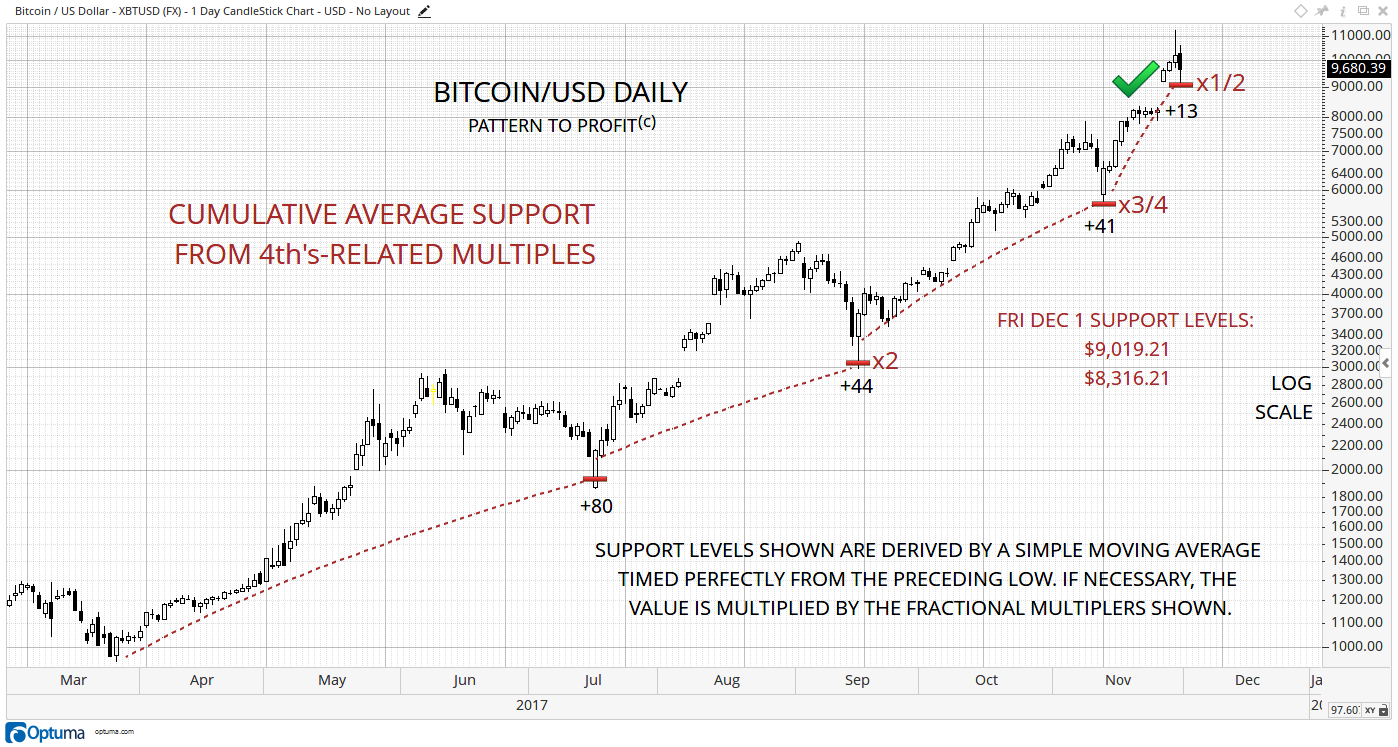
As expected, the market rallied strongly (almost doubling its value) from this interim low on November 30, 2017 at $9,117.55.
Here is the updated version:
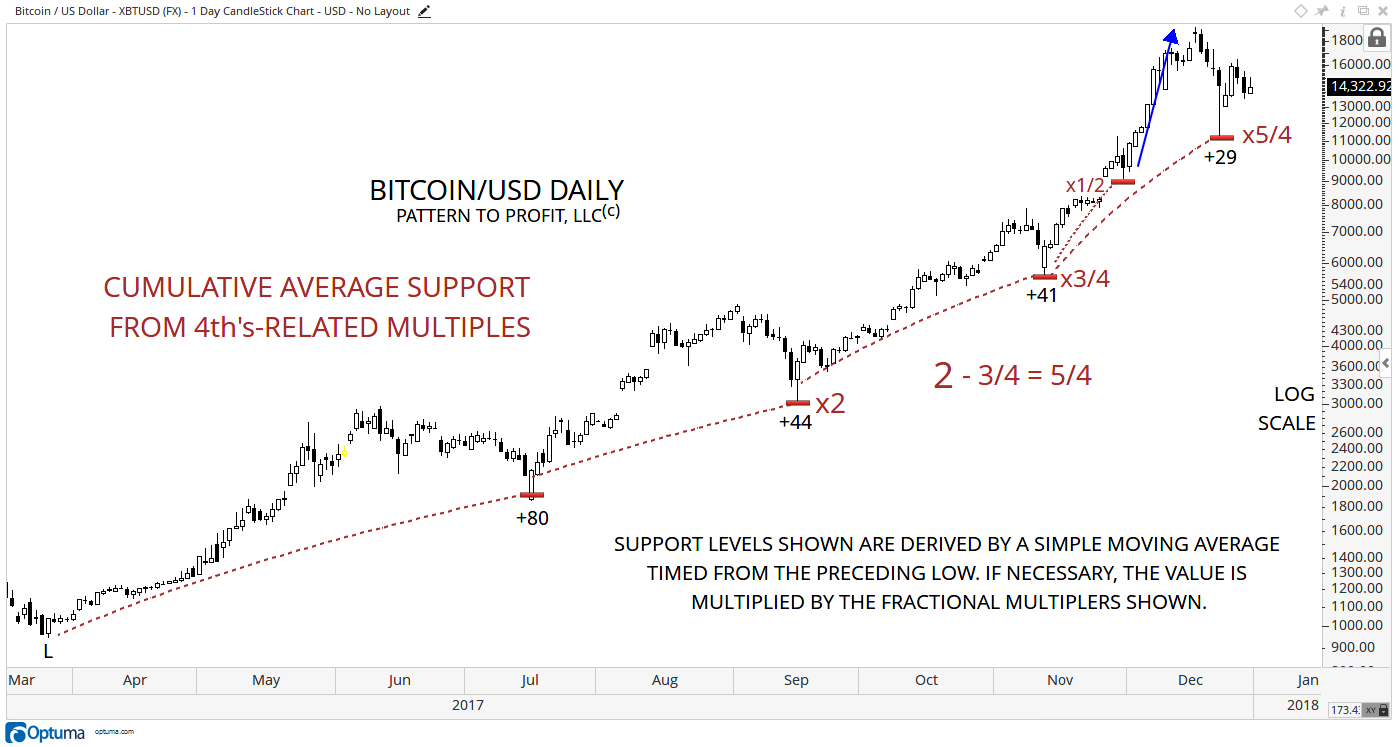
The recent low of December 22 reversed on a 5/4 multiple of its cumulative average from the preceding low of November 13, 2017 at $5,664.87 (which is on a 3/4 multiple from its preceding low).
Interestingly, these two fractions add to 2, which is the preceding low's multiple. Therefore, the recent low is perfectly harmonic with the entire series of lows, indicating that Bitcoin may have found its low.
The following analysis also reveals a relationship between the series of low, but geometrically:
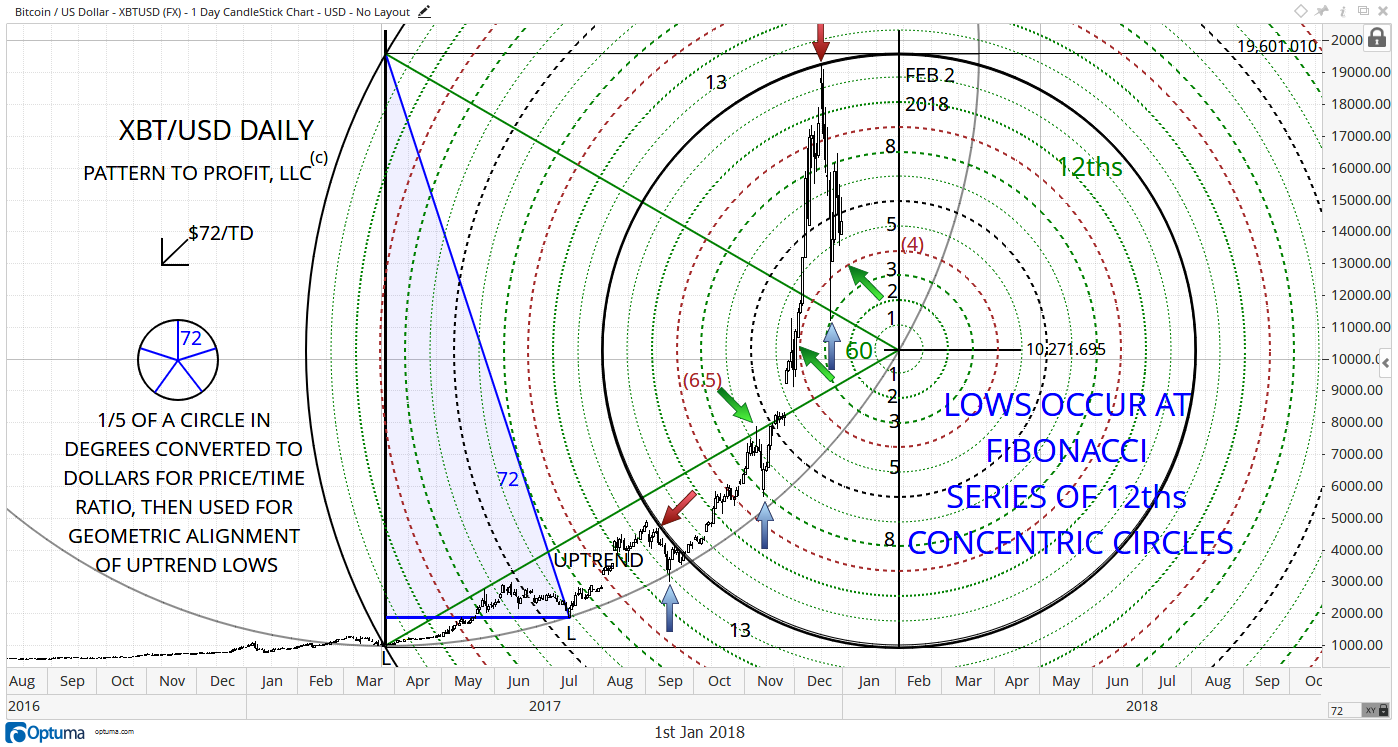
(The two red arrows show the all-time high and a secondary top identified with the main circle (solid black). In addition, the large faded circle connecting the two initial lows (both marked ‘L’) proves perfect support for the subsequent low. This indicates that this geometric set-up is indeed connected to market movement and should be further developed.)
A Fibonacci sequence of the 12ths concentric circles is present, and confirms the bullish implications of the preceding analysis, as well as indicates support for the current market on the 5th concentric circle, at around $13,900.
On the downside, if current support does not hold, then lower support on the 4/12 concentric circle (brown dashed) of $12,900 - $13,200 is next. Although the number 4 is not in the Fibonacci sequence, it does represent the ‘half-level’ between 3 & 5, along with 6.5 (between 5 & 8). Notice previous important price action at these circles (green arrows).
The 3rd concentric circle offers strong support for the December 22 low. There is an identical relationship of 5 circles with the two preceding important lows (3 blue arrows) of exactly 5 circles. If the market does continue to drop and take out circles 5 & 4, then this 3rd circle is a great back-up for support moving through January 2018 from roughly $12,000 to $12,650.
By adding angles based on 60/120 (hexagonal) from the triangle (green) apex, a clearer picture emerges for general trend/correction areas:
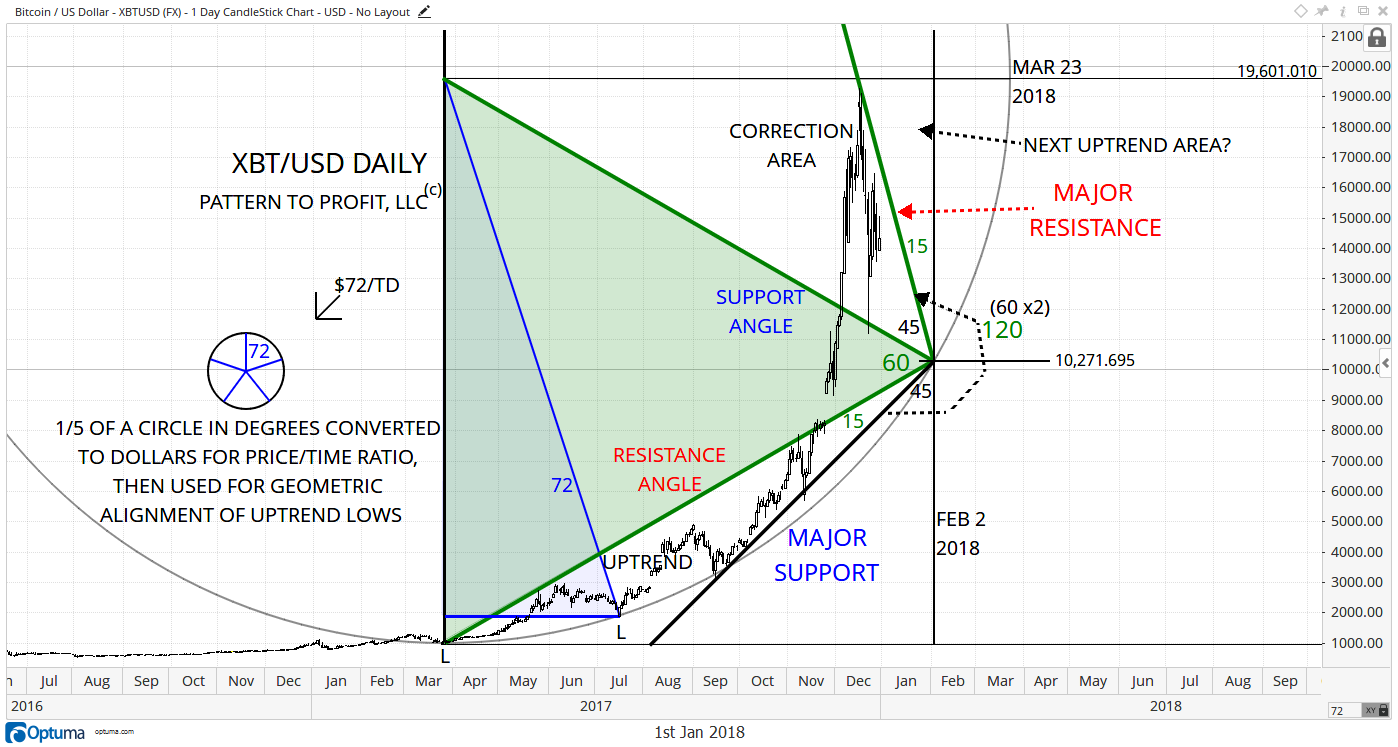
An ascending angle of 15o (green, from vertical) offers major resistance, while 120o counter-clockwise (rotated to the left) is major support (black). Note that 120 is double 60, which is the basis of the green equilateral triangle (all three angles are 60o), which identifies several tops as well as the recent low.
- Any attempt at resuming the major uptrend would receive confirmation by breaking out of the resistance angle, thereby escaping the correction area as outlined.
- February 2, 2018 and March 23, 2018 are both indicated as important timing points for potential reversals or strong trading days. Therefore, it is possible that the month of February sees a bit of consolidation. We’ll have to watch closely.
Disclosure: Pattern to Profit, LLC, any affiliates or employees or third party data provider, shall not have any liability for any loss sustained by anyone who has relied on the information ...
more

