
Inflationary Expectations And Recession Risk
Inflation’s back, right? I mean, look at the chart below. At last look, annual inflation in the Consumer Price Index (the black line) was 2.3 percent. In late 2015, the inflation rate was zero. It’s been stair-stepping upward, in fits and starts, ever since.
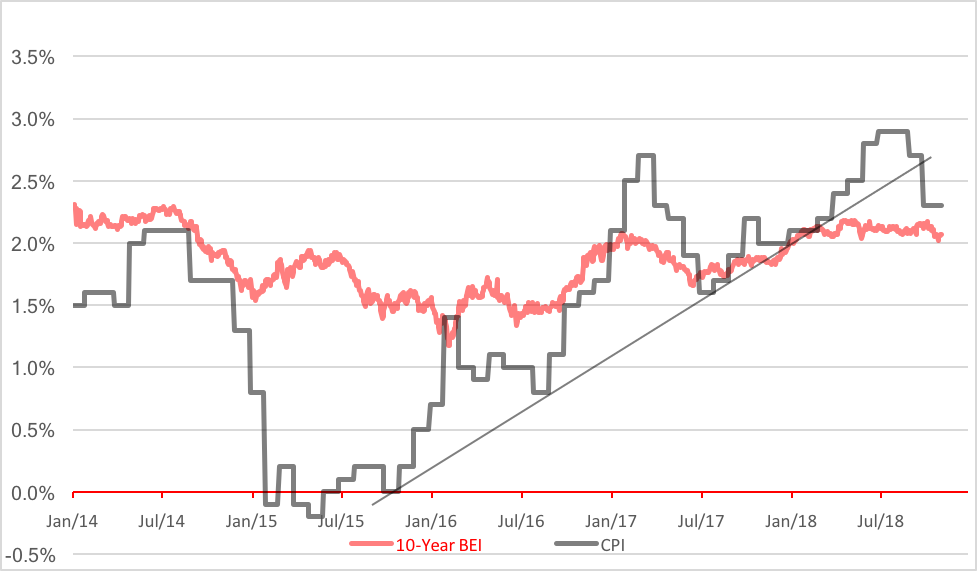
But the trajectory of CPI’s three-year rise has clearly slowed. You might even say its trend line’s been broken. But that’s not the only significant development in this chart. The momentum in the 10-year breakeven inflation (BEI) rate’s also been disrupted.
Call the BEI the market’s expectation of future inflation. It’s the difference between the yield on a conventional 10-year T-note and that of a Treasury Inflation-Protected Security (TIPS) of the same maturity. It’s called the breakeven rate because it’s the threshold investors consider when opting for TIPS over traditional paper. As of Friday, the market was pricing in 2.04 percent annual inflation over the next ten years. If investors think inflation will average more than that in the coming decade, they’ll buy TIPS. If not, they’ll buy nominal Treasuries.
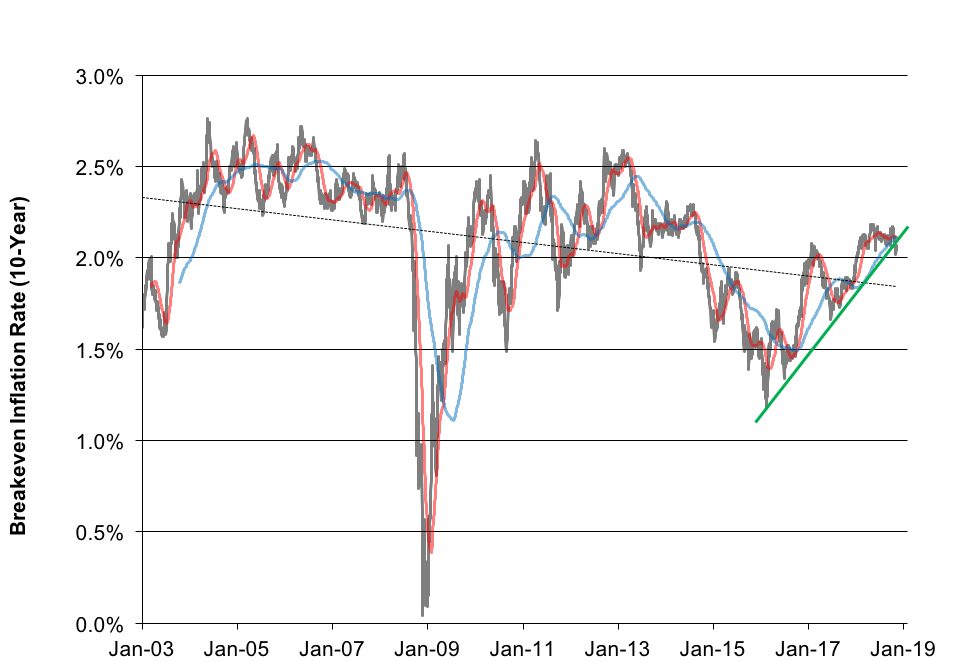
So where’s the disruption? Perhaps you’ll see it better in isolation. Regard the chart below. Here, the 10-year BEI is depicted alongside its 50-day (red line) and 200-day (blue line) moving averages. Over the last three trading days, the 50-day average has dipped below the 200-day in a so-called “death cross.”
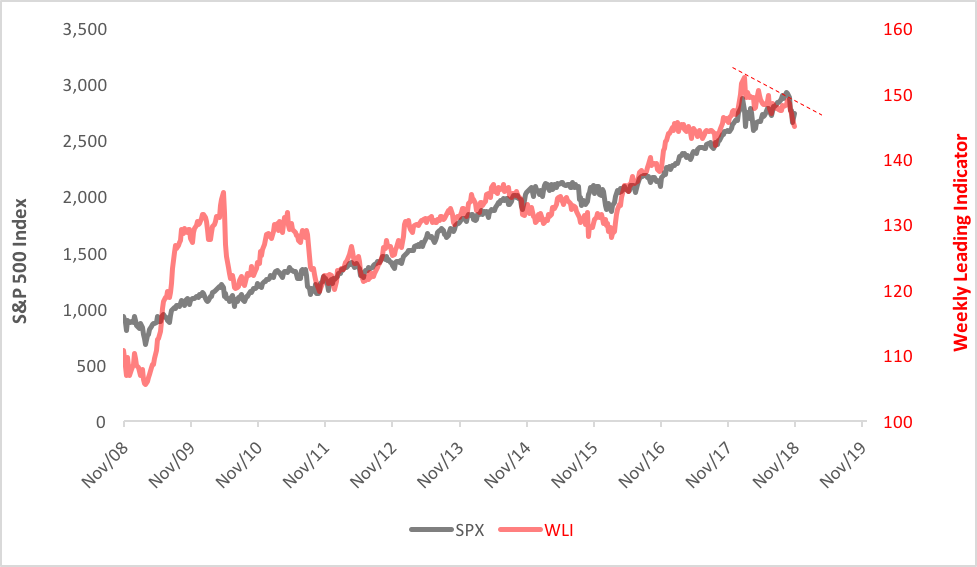
It’s not as if deflationary expectations just cropped up. Actually, there have been signs for weeks. For one thing, the annual growth rate of the Weekly Leading Indicator Index, published by the Economic Cycle Research Institute, has gone negative to a level not visited since early 2016. The WLI, as its handle implies, leads cyclical turns in U.S. economic activity (see our previous column highlighting WLI here).
Do all these charts point to recession? Well, no, not necessarily. But there’s a relationship between deflation—technically defined as two consecutive quarters of negative CPI growth—and recession. Typically, deflation occurs during or in the wake of an economic slowdown. So let’s not put our cart ahead of our fiscal horse. We’re not in a slowdown. Yet. And we’re only seeing braking in the inflation rate. We’re a long way from a negative rate.
Still, the RISK of recession has increased. FEAR of recession is mounting.
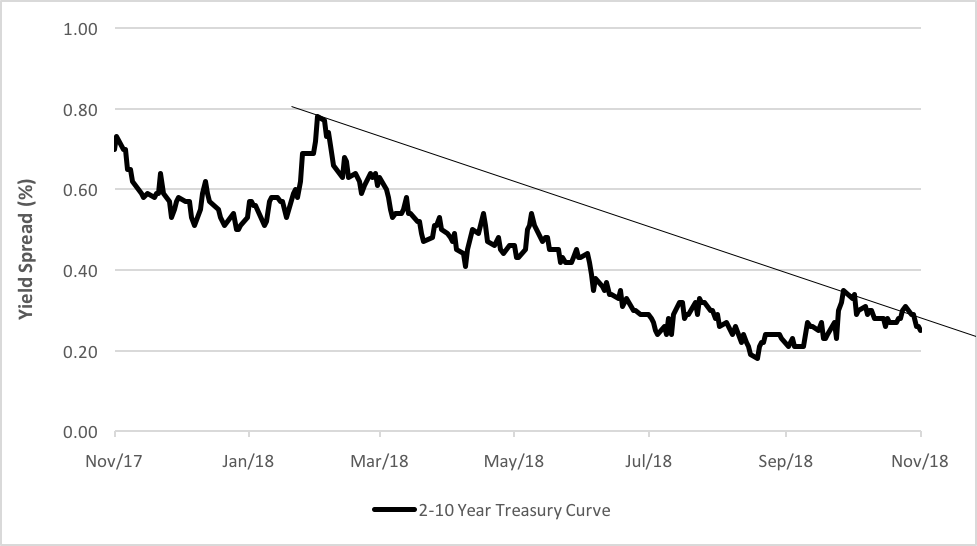
So what’s the bottom line? Just how close to a recession are we? And how soon must we realign our portfolios to gird ourselves from its depredation? Well, the odds of recession grow exponentially whenever the Treasury yield curve inverts, so it’s worth keeping an eagle eye on that chart (below). Over the past 12 months, the yield premium of the 10-year Treasury note over the 2-year has shrunk by nearly half a percentage point—about two thirds. You should have a defensive plan mapped out in the event of further flattening.
Disclosure: None.


