
How Technical Analysis Guides Short-Term Trading In A Volatile Market
The Dow Jones Industrial Average was down 700 point, then up 600 points. Then it was down 500 … and then 400 more before finally going up 500. That kind of volatility is enough to give the strongest, most experienced traders an upset stomach! If you’re looking for clarity when trading a volatile market, I’ve got the remedy. It’s called technical analysis.

Now, don’t get me wrong. Fundamental analysis is valuable – but it only works well over the long term. Volatile markets are short-term in nature. Using technical analysis, studying charts and interpreting the indicators will provide you with some guidance as to what’s happening right now and how to respond quickly.
My go-to technical analysis tools for volatility
Momentum Indicators
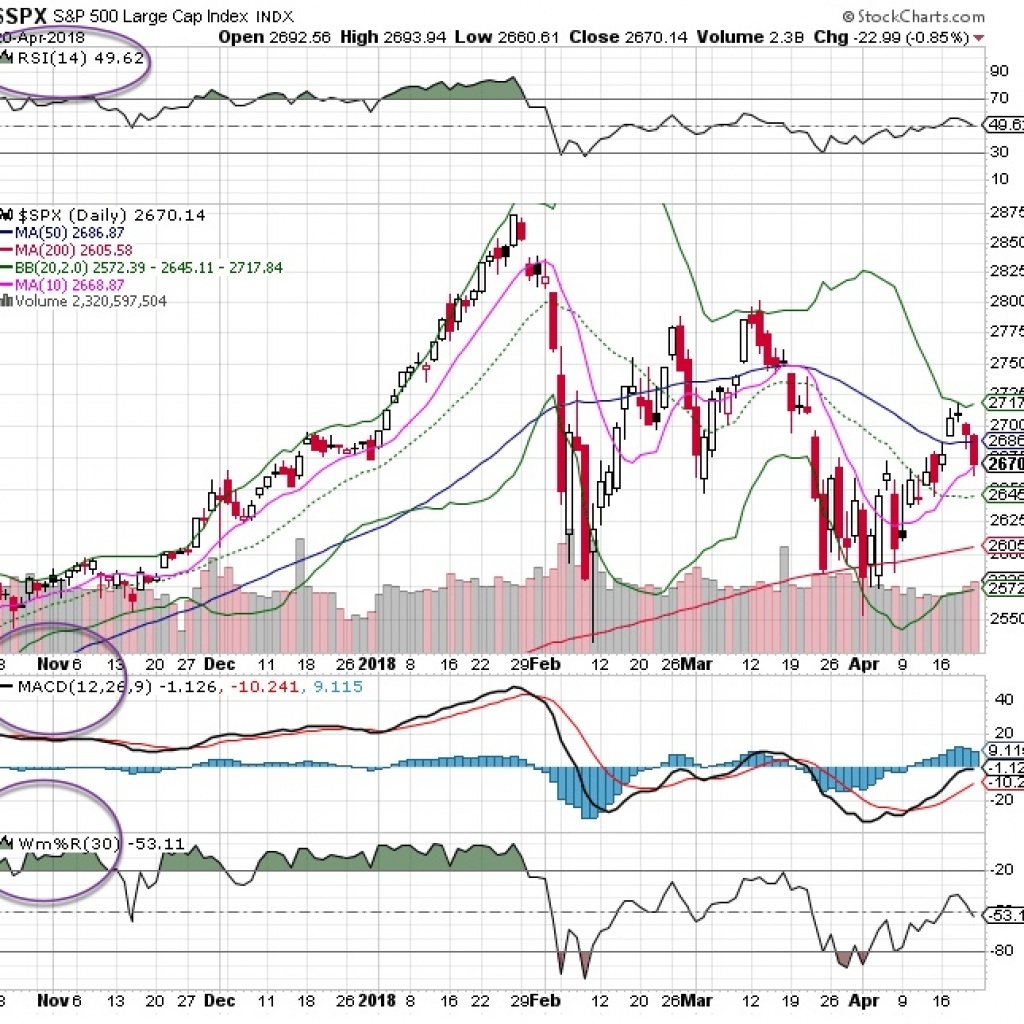
When facing volatility, I like to use momentum indicators to help me find the best trends. My top two picks are the MACD and relative strength index. These powerful tools show me when a trend change is about to occur and how powerful the move will be.
Three other indicators that are also helpful include the average directional movement (strength of the trend), rate of change (the power of the change at the turn) and on-balance volume.
Oscillators
Oscillators are another good way to read whether a stock is moving within a range or breaking free. (Oscillators can be leading or lagging indicators, so keep that in mind when choosing what to follow.) I like to use Williams %R, because the accumulation/distribution line is a solid indicator that tells me where money is flowing, but my favorite is the Chaikin Money Flow Index.
(Click on image to enlarge)
Sentiment Analysis
Human behavior never changes. Money moves into the market as greed takes over, and it moves out when fear takes over. When sentiment shifts to an extreme level, I often go against the tide. Too much bearish sentiment likely means the markets are ready to turn upward, while too much bullish sentiment indicates complacency, making it a good time to take money off the table or short the markets.
Some of the better sentiment data is available via AAII, Institutional Investor, the Fear/Greed Index from CNN, Barron’s and TD Ameritrade’s Investor Movement Index.
Moving Averages
Moving averages and bands allow you to overlay indicators over price action. I prefer to use bollinger bands, which provide two standard deviations around a 20 ma or 95% of price action. Some of the strongest trends can be identified when the bands expand from a contraction. As an options trader, that is what I’m looking for.
Other very good tools include the Ichimoku Cloud Analysis, Moving Average Envelopes and the Aroon Indicator.
When the markets provide conflicting signals, it’s time to reach for the charts and use technical analysis. The tools I discussed above will help you read the market objectively so you can make smart options trading decisions.


