
Yield Curves Flattening In High Income Countries
A recent article on the predictive abilities yield curves (Shrager/Quartz) includes a nifty interactive which allows you to look at yield curves over time. Below, I do a snapshot comparison, across the world.
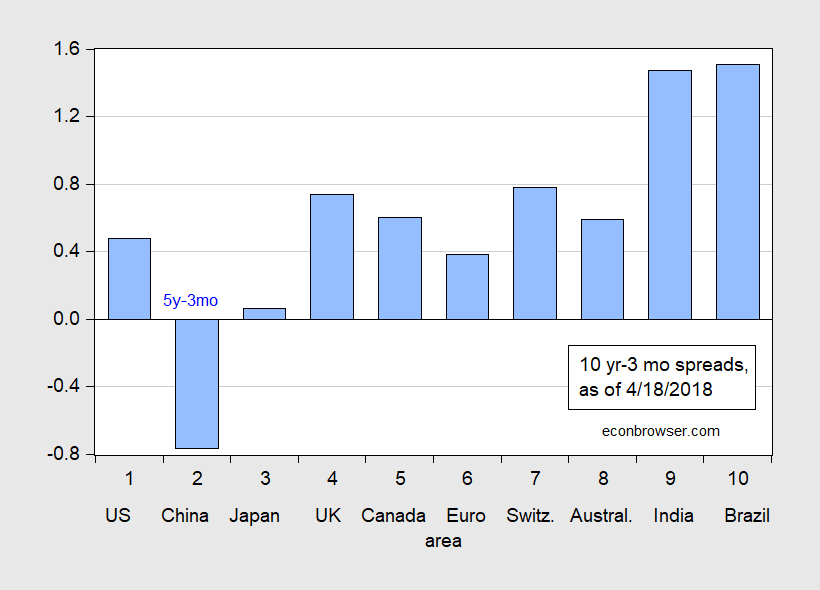
Figure 1: Ten year-three month term spread (blue bars), as of 9 July 2016. China observation is Five year-three month term spread. Euro ten year rate is for Germany. Source: Economist, data as of April 18.
It’s hard to compare across countries, particularly without knowledge of what is the average term premium in each country. (See Chinn and Kucko (2015) for a cross country assessment of the predictive power of yield curves for economic activity and recessions.) However, one can easily compare what the spreads have done since a last check (in this case July of 2017). This is shown in Figure 2.
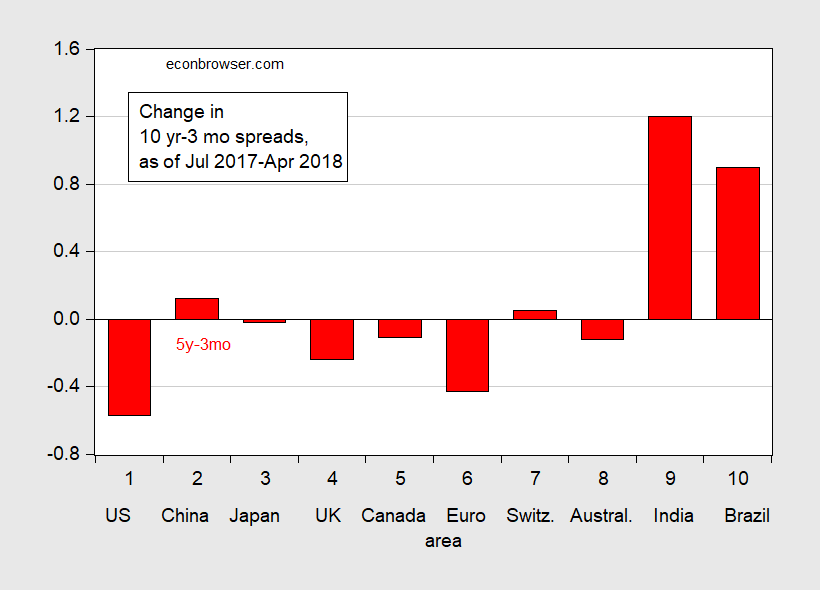
Figure 2: Change in the ten year-three month term spread (red bars), from 5 July 2017 to 18 April 2018. China observation is Five year-three month term spread. Euro ten year rate is for Germany. Source: Economist, and author’s calculations.
It’s clear yield curves have flattened for four high income countries plus the euro area (as proxied by Germany’s yields). In Chinn and Kucko (2015), we found that the yield curve was a useful predictor of recessions for US, Germany, France, and Canada — but not the UK (we did not evaluate Australia).
One pertinent question is whether the flattening is due to higher short term rates or to lower long term rates. (Wright emphasizes a term spread regression incorporating the level of short rate, for instance; in Chinn-Kucko, we find a specification w/o short rate works better.) Figure 3 provides a graphical depiction of the decomposition of changes in spreads shown in Figure 2.
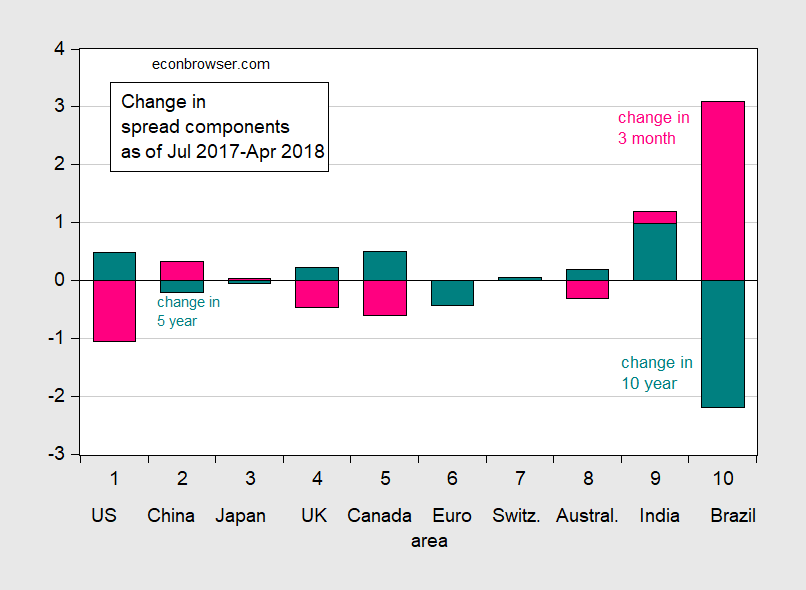
Figure 3: Change in the ten year rates (teal) and negative of change in three month rates (pink bars), from 5 July 2017 to 18 April 2018. China observation long rate is five year rate. Euro ten year rate is for Germany. Source: Economist, and author’s calculations.
For the US, UK, Canada and Australia, the component accounting for most of the flattening is the higher short rate. For the high income countries, only for the euro area is the majority of the flattening associated with a declining long rate. (Contrast this with what was happening in 2016, as recounted in this post).
If the pure expectations hypothesis of the term structure w/time invariant term premium applied, we could attribute the decrease in German long rates as purely a drop in expected future spot rates. It’s not clear we can do that; it’s also not clear to me we can’t. Conversely, the rise in long rates in the US could be due to a reversion of the term premium to its longer run average.
Disclosure: None.


Interesting. Perhaps the UK avoids recession because it has the largest financial presence. It has many ways of earning off any financial change. It would be nice if someone could study that concept.