
Who Could’ve Known "Crash Brexit" Would Be Problematic?
In the aftermath of the Salzburg summit, where the Chequers plan was dismissed by the EU, and PM May demanded “respect”, the pound has plunged.
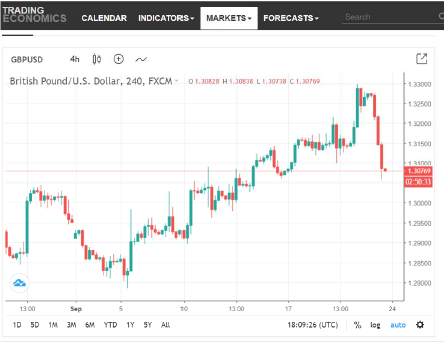
Source: TradingEconomics.com.
Deutsche Bank (Harvey, et al., “Deep impact: DB forecasts in a crash Brexit”) yesterday lays out why:
In our analysis, we calculate that UK growth will be around 4% cumulatively lower than under our baseline scenario by end-2020. The UK will enter a two year recession, with output shrinking -0.3% and -0.6% in 2019 and 2020 respectively. The main contributers to the fall in demand are household consumption, which shrinks around 6% relative to our baseline, and business investment which is 13% lower than our baseline. Net trade is assumed to add a moderate boost to GDP, as while trade falls substantially, imports fall slightly more than exports.
While there is considerable debate about the monetary policy response to a crash Brexit, we expect the Bank of England to announce a broad based easing package, including a cut to the base rate to 0%, more QE and corporate bond purchases, a new TFS program and a reversal to rises in the counter cyclical capital buffer. The fiscal response is more politically dependent and less predictable. With a large fiscal response (taken to be GBP 25bn of additional borrowing a year), the loss of output is less severe, with the UK economy growing 0.2% and 0.5% in 2019 and 2020 respectively.
While the difficulties in forecasting the economic performance of the UK economy in the wake of a crash Brexit are manifold, one thing is certain. Crash Brexit is not an end destination for the UK. From day one, negotiations between the UK and EU27 will resume on a future economic relationship.
In other words, the terms of trade for UK drops, the monetary authorities will try to offset some of the demand shock with expansionary policy, both resulting in a currency depreciation; at the same time, policy uncertainty is heightened.

Figure 1: UK Economic Policy Uncertainty index (blue, on log scale). September observation daily average through 9/21. Source: policyuncertainty.com and author’s calculations.
Disclosure: None.


