
USD/JPY Testing Deep 88.6% Fibonacci Level At 112
USD/JPY
4 hour

The USD/JPY is probably in a wave 1-2 (blue) unless price breaks below the bottom of wave 1 (blue). A larger ABC (brown) could be taking place within wave 2 (blue). A wave 2 (blue) correction typically last between 100% and 161.8% of wave 1 (see bottom scale).
1 hour
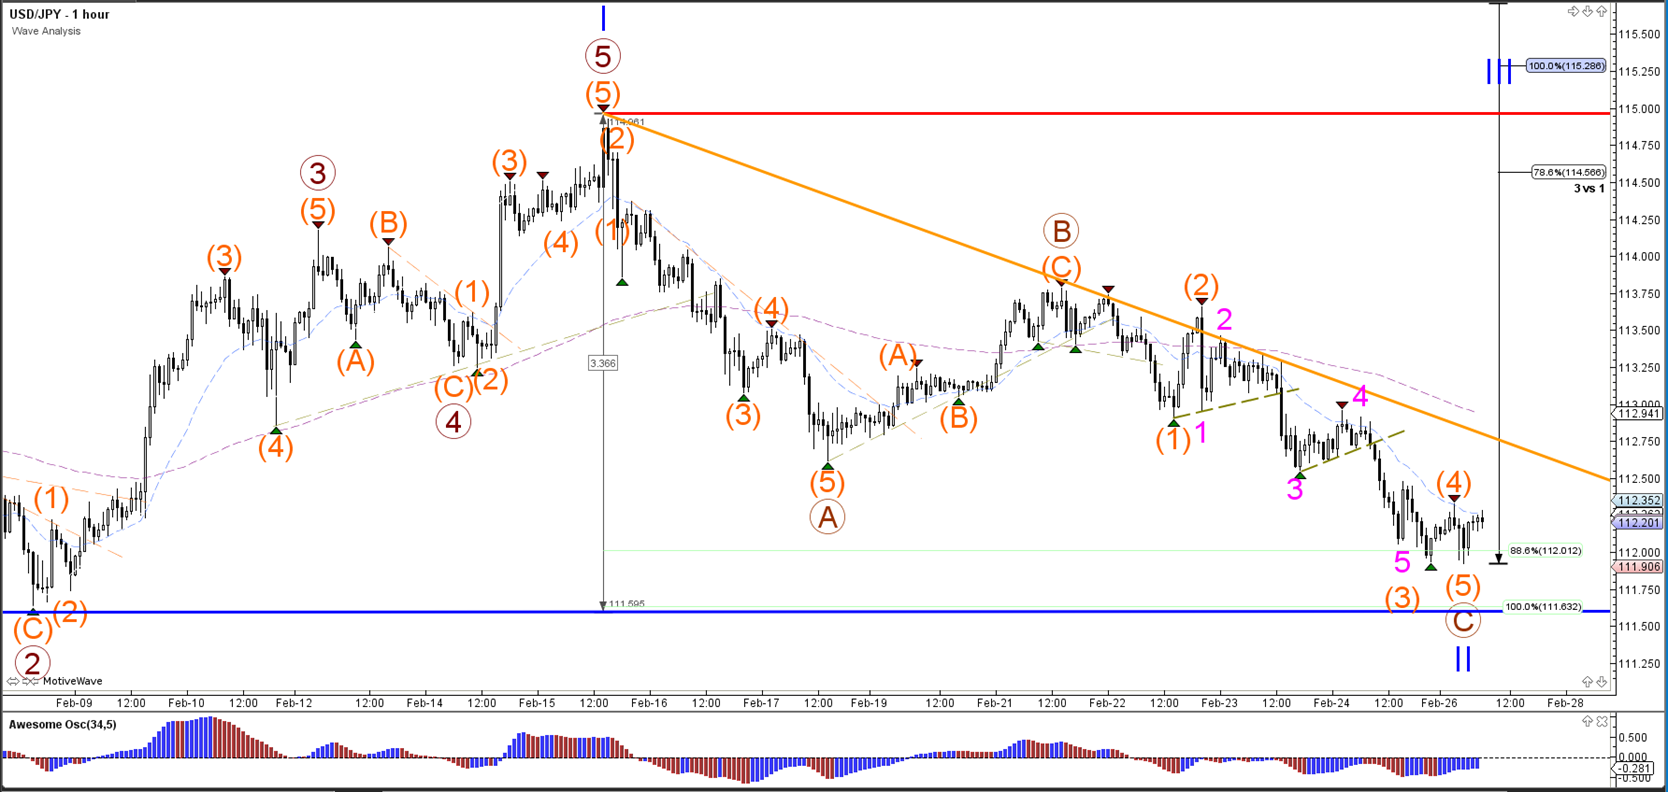
The USD/JPY is respecting the 88.6% Fibonacci retracement level of wave 2. A break above resistance (orange line) could indicate that the correction is finished.
EUR/USD
4 hour

The EUR/USD is showing a bullish WXY correction (blue/green) within a wave 2 (purple). The wave 2 Fibonacci retracement (purple) levels are potential bouncing spot and reversal levels. A break above the 100% level of wave 2 vs 1 (purple) invalidates it.
1 hour

The EUR/USD could have completed a bearish ABC zigzag (blue) within an expanded bullish correction via a WXY (green) within wave Y (blue).
GBP/USD
4 hour

The GBP/USD failed to break above long-term resistance (brown) and showed a strong bearish turn instead. The wave count is therefore now showing a completed wave C (blue) and price could continue with the bearish momentum and break below support (blue).
1 hour

The GBP/USD showed bearish momentum which has been labelled as a 5 wave (orange) sequence as a wave 1 (blue). Price could now build a retracement within wave 2 (blue) but a break above the 100% level invalidates it.
Disclosure: None.


