
USD/JPY At 78.6% Fibonacci Level After 88.6% Bullish Bounce
EUR/USD
4 hour

The EUR/USD made a bearish turn at the resistance of wave X (purple) as expected and has now posted a lower low. Price could still move higher to build a potential head and shoulders pattern (pink) before completing a fall towards the bottom of the consolidation (blue).
1 hour

The EUR/USD has either completed an bearish ABC (green) and will now make a bullish ABC (pink) or price is in a wave (purple). A break above resistance (dotted green) invalidates wave 4 (purple) whereas a break below support (green) could start wave 5 (purple).
GBP/USD
4 hour

The GBP/USD is either building a wave 3 (pink) within a larger downtrend or in a wave d (purple) of a larger ABCDE contracting triangle (purple). A break above the resistance zone (red/orange) increases the chance of a wave d and e (purple) whereas a break below the bottom (blue) of wave b (purple) favours a wave 3 (pink).
1 hour

The GBP/USD is building a fall wedge chart pattern on the 1 hour chart (red/green lines). Price is now at the resistance trend line (red) which is a bullish break or bearish bounce spot.
USD/JPY
4 hour
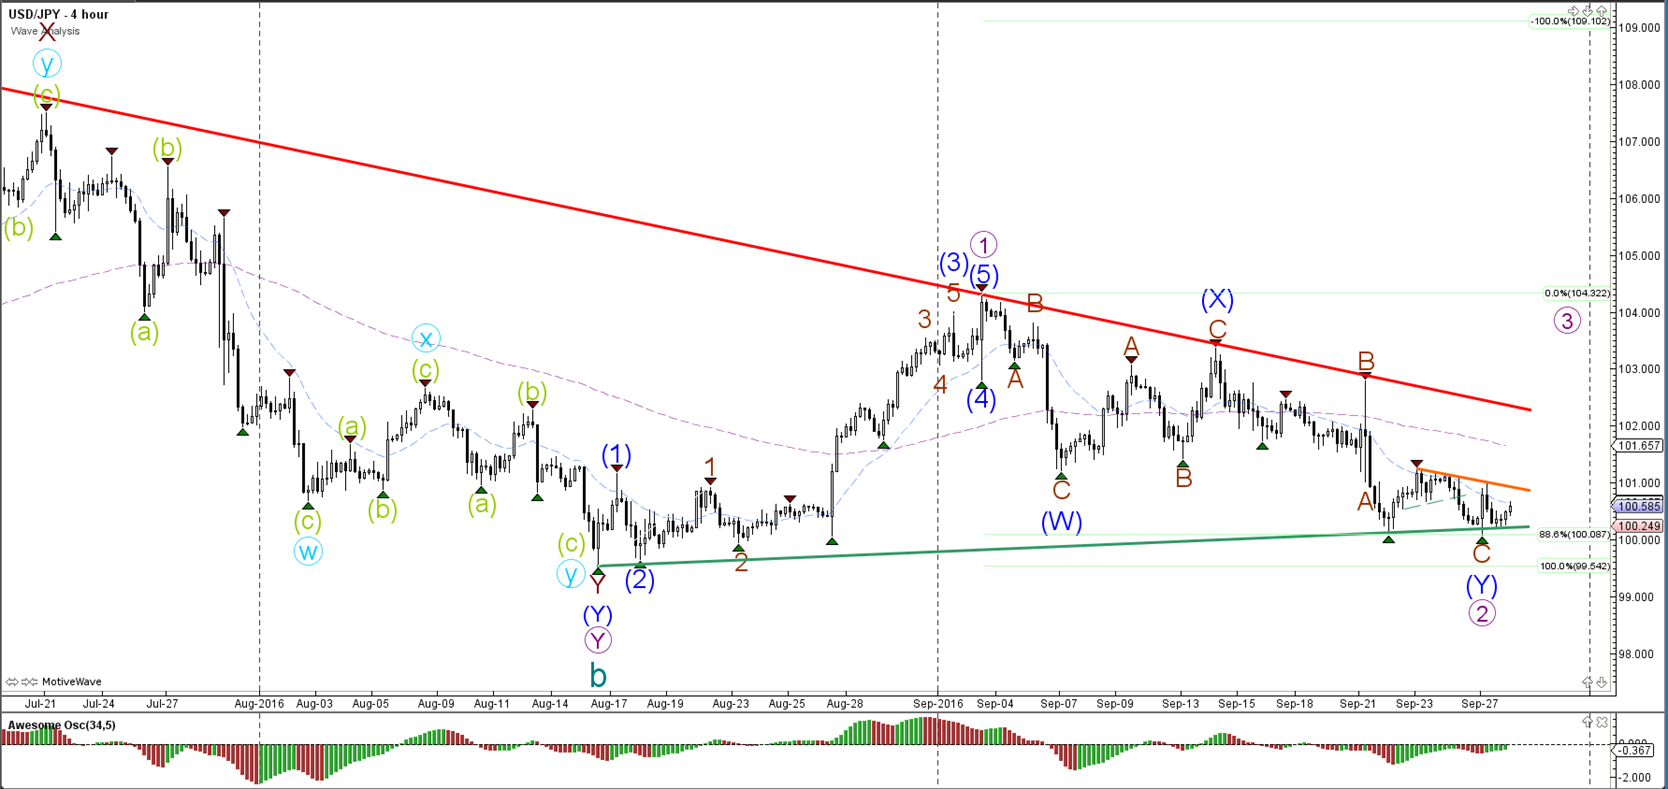
The USD/JPY remains stuck between the resistance of the daily downtrend channel (red) and the support of the various bottoms (green) and 88.6% Fibonacci level of wave 2 (purple). A break below the bottoms invalidates the bullish reversal, whereas a break above the bearish channel confirms the potential for a wave 3 (purple).
1 hour
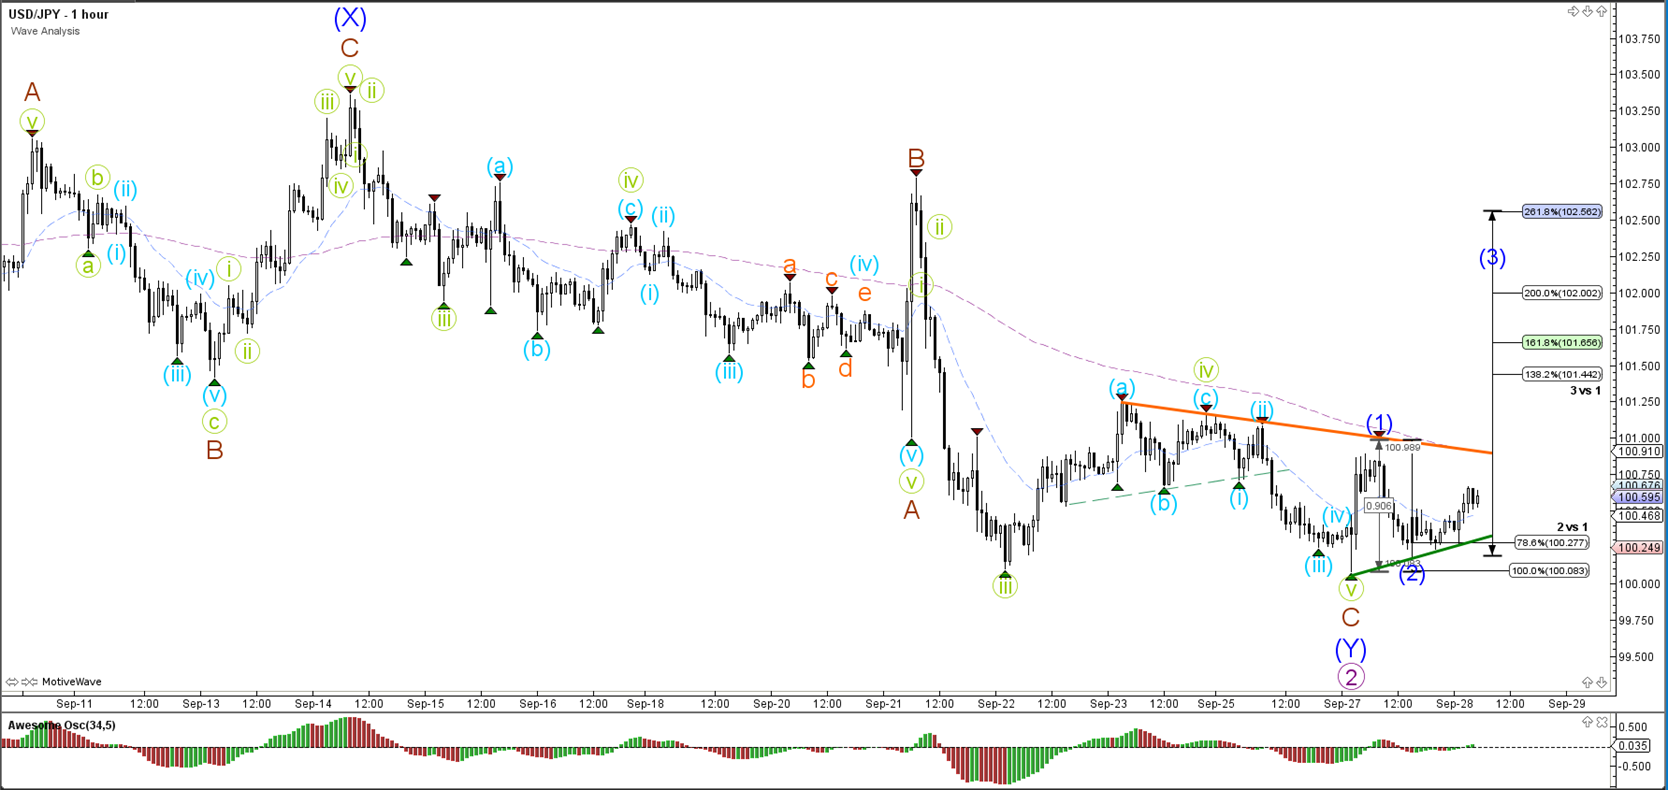
The USD/JPY retraced back and bounced at the 78.6% Fibonacci level of wave 2 (blue). A break above the resistance (orange) could start the wave 3 (blue) but a break below the 100% Fib invalidates wave 2 (blue).


