
USD Shows A Wide Range Of Waves Versus EUR, GBP And JPY
EUR/USD
4 hour
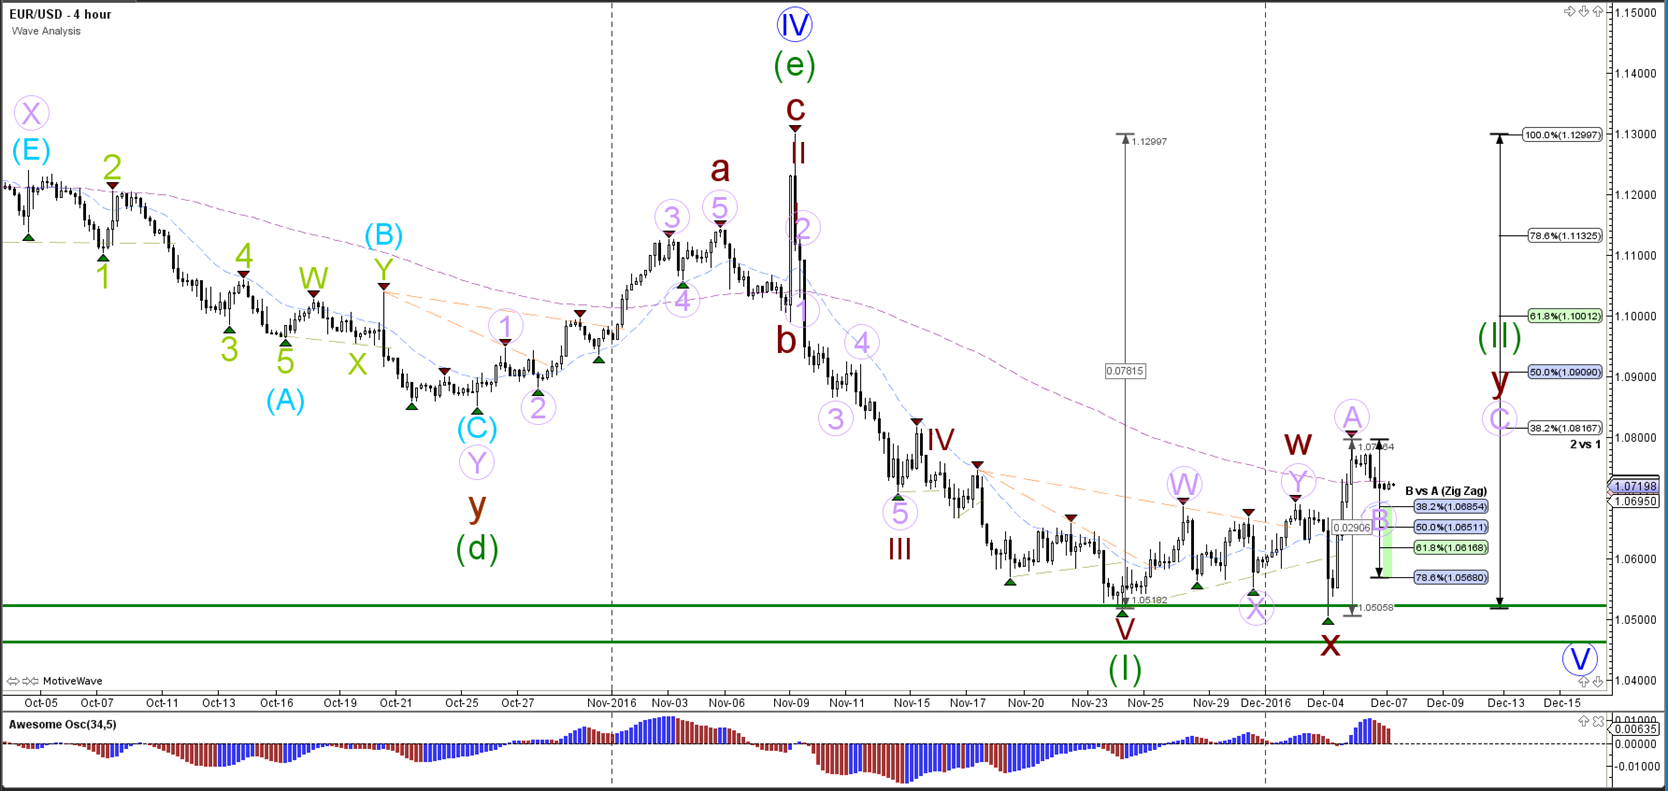
The EUR/USD bullish bounce at the support zone (green lines) could see a continuation higher once price completes a wave B (purple) at one of the Fibonacci levels. The bullish zigzag should price towards the Fib levels of wave 2 (green) without breaking above the 100% level (invalidation).
1 hour
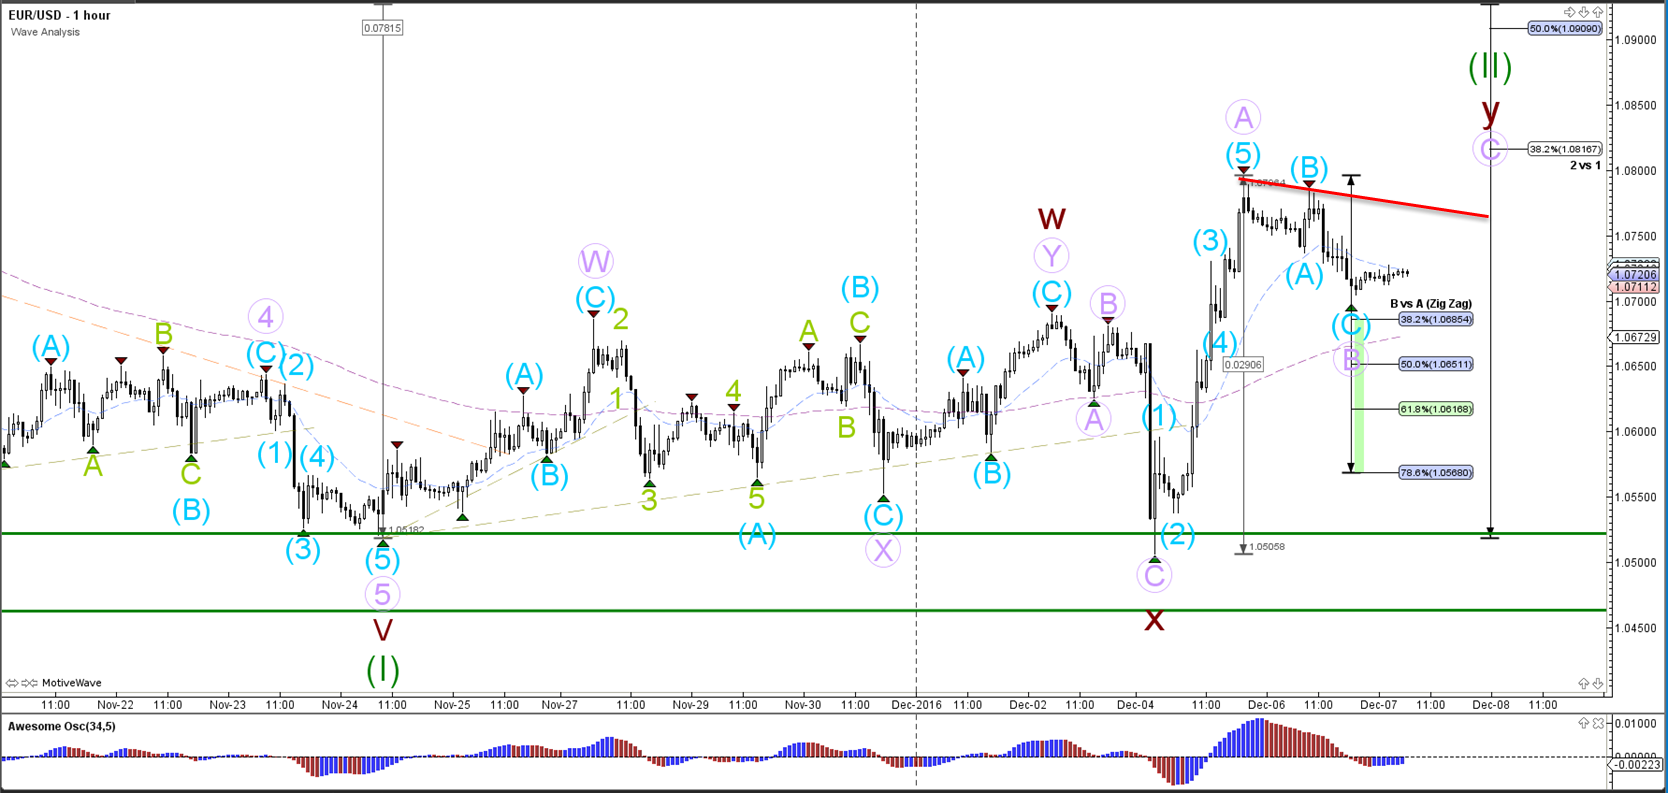
The EUR/USD failed to break the top and built a larger ABC (blue) correction instead within wave B (purple). Price needs to break above resistance (red) before a wave C (purple) is confirmed. Price could have completed the wave B (purple) at the 38.2% Fib but could also retrace deeper towards the 50% Fib, which will depend on the price action during the European and London open.
GBP/USD
4 hour
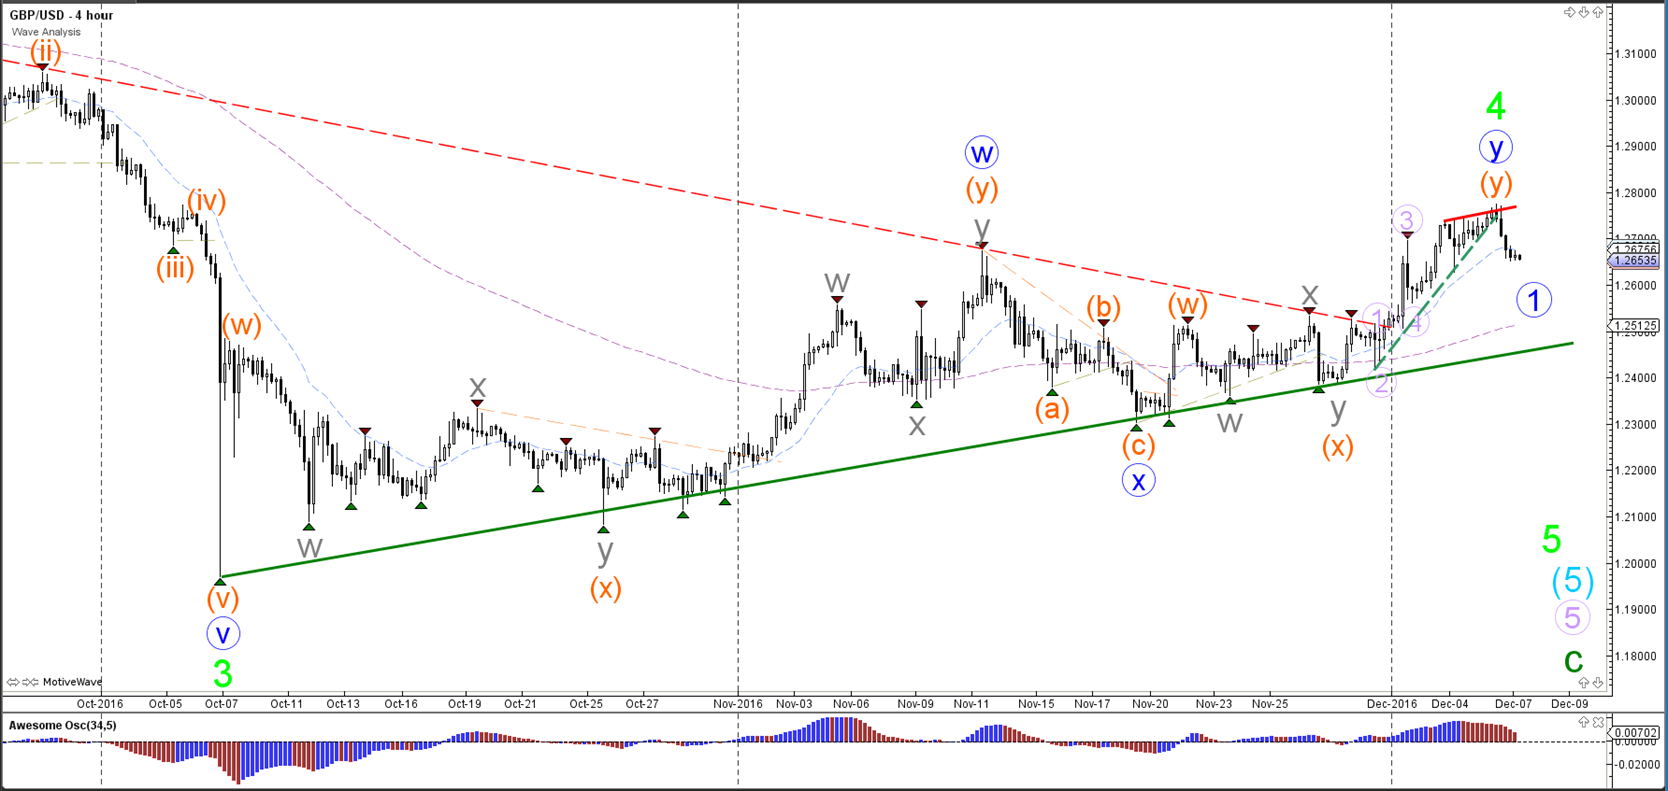
The GBP/USD indeed broke the rising wedge chart pattern which was mentioned yesterday. Price broke below the support trend line (dotted green) which could indicate that the WXY (blue) correction is completed within wave 4 (green).
1 hour
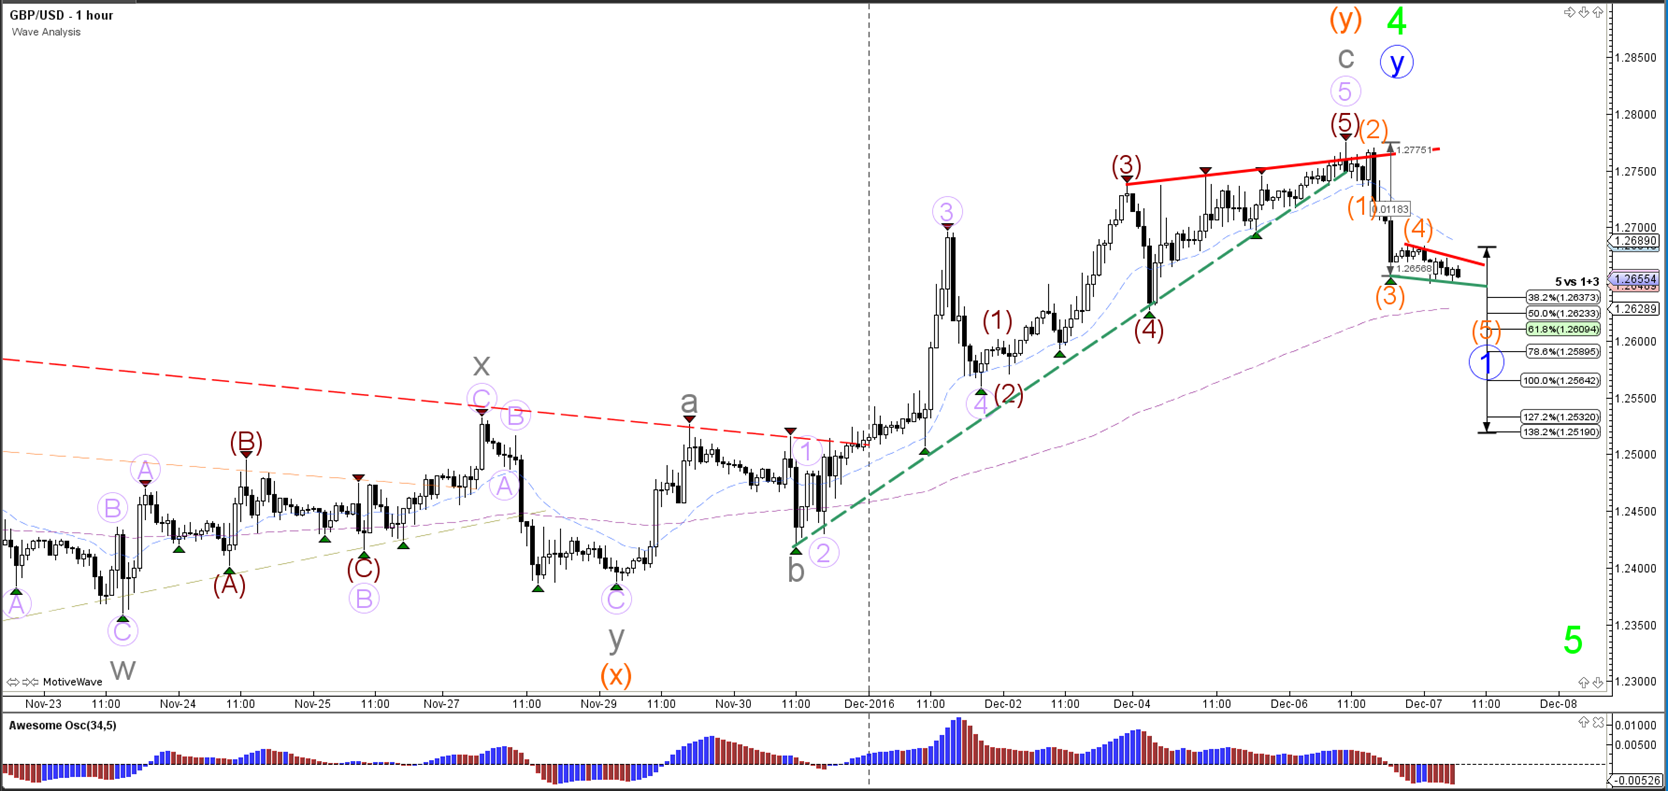
The rising wedge formation was an indication of a potential reversal pattern and price seems to be building bearish 5 waves as part of a potential new trend.
USD/JPY
4 hour
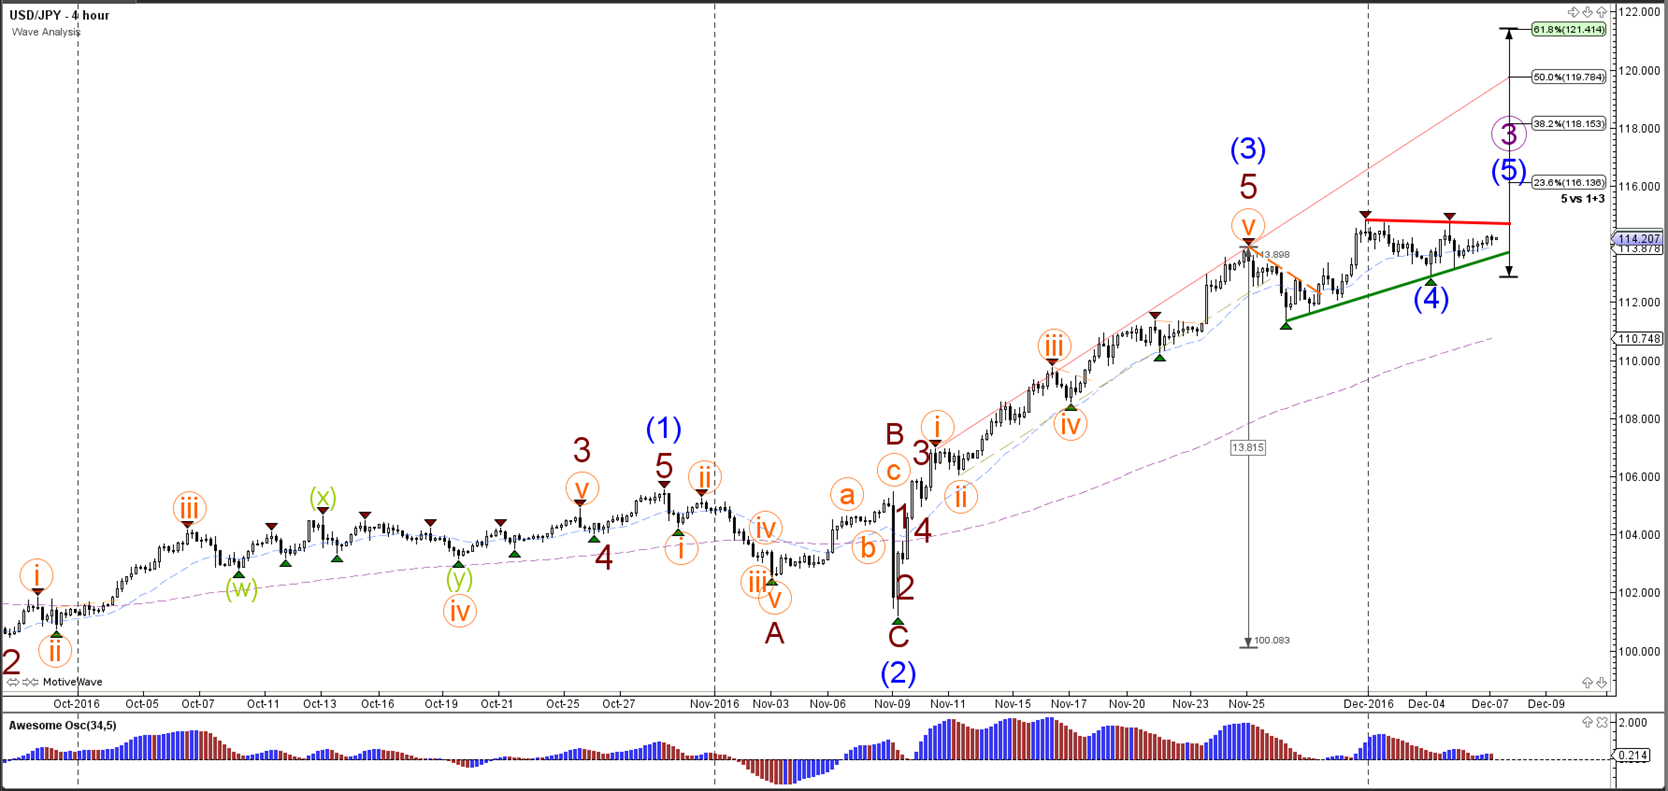
The USD/JPY uptrend is pausing and showing a larger correction after completing a wave 4 (blue) and potentially multiple waves 1-2 (orange/brown). A break above resistance (red) could see price continue higher towards the Fib targets of wave 3 (brown).
1 hour
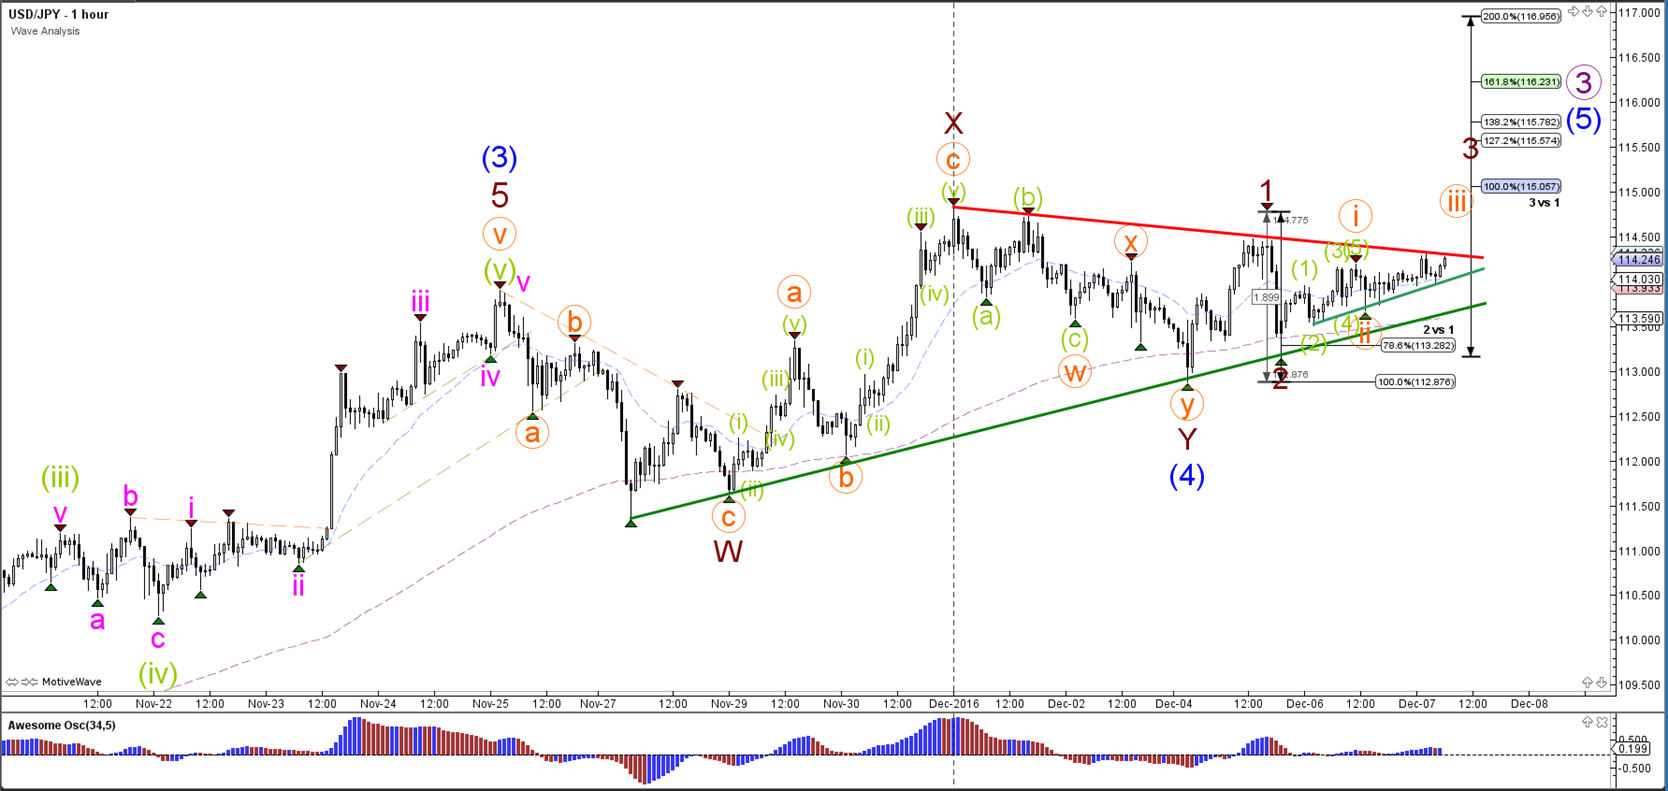
The USD/JPY could be building a 5 wave extension (brown) within the wave 5 (blue). A break below the 100% Fib of wave 2 vs 1 invalidates the wave 2 (brown). A break above resistance (red) could see wave 3 (brown) continue.
Disclosure: None.


