
US Dollar Jumps To July High, GBP/USD Folds On Inflation Data
US DOLLAR JUMPS TO FRESH JULY HIGH, PULLS BACK AHEAD OF DAY TWO OF POWELL TESTIMONY
The bullish jump in the US Dollar that started to show yesterday ahead of Jerome Powell’s testimony has continued, and the currency is pulling back a bit after establishing a fresh July high. Just yesterday morning the Greenback was testing support at 94.30, but as Day One of Jerome Powell’s testimony neared, the Dollar began to firm and that theme continued into this morning’s trade.
At this point, we’re making a hard-charge towards the June resistance at 95.53, and this is the one-year high in DXY. It appears as though we’re setting up for a showdown here at some point later today, but the big question, of course, is whether buyers will be able to keep pushing or whether we’ll see a third reversal from around the 95.53 level.
US DOLLAR VIA ‘DXY’ HOURLY PRICE CHART: JUMP TO FRESH JULY HIGHS FROM FIBONACCI SUPPORT
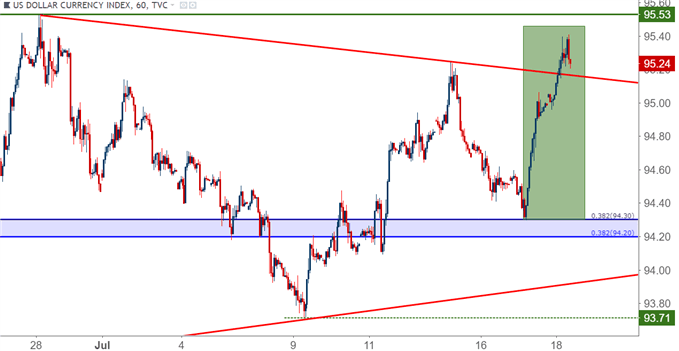
Chart prepared by James Stanley
Should prices pose a topside break of that June swing-high, potential resistance exists at 96.04 as the 50% marker of the 2017-2018 sell-off; followed by 96.47 (the 23.6% retracement of the 2011-2017 major move) and then a confluent area around 98.00. Each of these were targets presented in our Q3 Technical Forecast on the US Dollar, which is available directly from the following link: US Dollar Q3 Forecast, DailyFX Trading Guides.
US DOLLAR VIA ‘DXY’ DAILY PRICE CHART
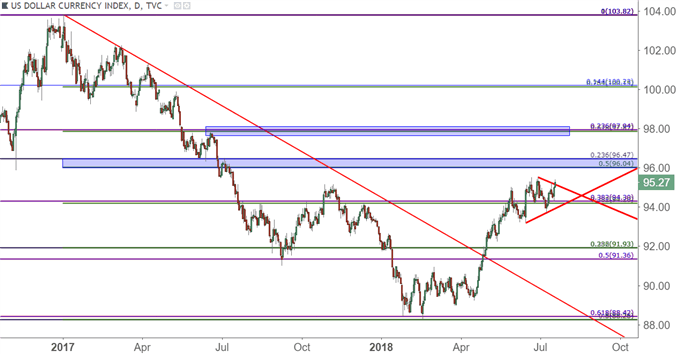
Chart prepared by James Stanley
GBP/USD CRUSHED TO FRESH 10-MONTH LOWS, 1.3000 IN SIGHT
Contributing to this morning’s Dollar strength is another wave of weakness in GBP/USD, although this time the driver is coming from an economic theme rather than a political one. We had looked into this scenario in yesterday’s webinar, highlighting the fact that the Fibonacci level at 1.3117 was continuing to face support tests, and was unlikely to hold up for long should bears continue to persist.
This morning that bearish drive caught another driver with the release of June inflation figures out of the UK. Inflation came in last month at the same 2.4% that we’d seen in April and May, and this was well below the expectation of 2.6%. This also helps to dim the prospect of a rate hike out of the BoE at their August ‘Super Thursday’ rate decision. As we’ve been saying, November would appear to be more likely for a rate hike, if we get one at all, as negotiations between the EU and the UK would have already begun, and Mark Carney and the BoE would have a bit more clarity for how Brexit will actually be executed.
UK INFLATION: THREE CONSECUTIVE MONTHS AT 2.4% MAKES LESS COMPELLING CASE FOR RATE HIKES
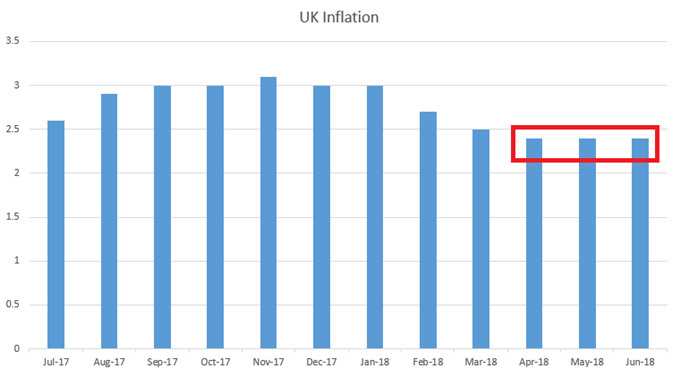
Chart prepared by James Stanley
In GBP/USD, the big question is what happens at 1.3000. We’ve seen a bit of support show ahead of a test of this level, and we haven’t seen the pair trade here since last September. If we do see a hold of support should 1.3000 come into play, the door could soon open to bullish reversal possibilities.
GBP/USD DAILY PRICE CHART: TO FRESH 10-MONTH LOWS, FAST APPROACHING 1.3000
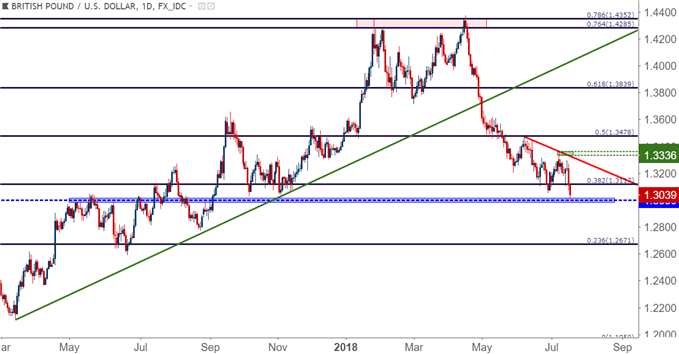
Chart prepared by James Stanley
EUR/USD BREAKS LOWER: ARE WE HEADED FOR ANOTHER SHOWDOWN AT 1.1509?
The downtrend in EUR/USD last quarter was one of the more workable themes available to FX traders, but the bulk of the move really showed from late-April into late May, at which point prices began to bounce ahead of the 1.1500 psychological level. In early-June, prices ramped higher in anticipation of the ECB announcing a stimulus exit; but when this actually happened, and with the bank said that they were anticipating rates staying at current levels ‘at least through the summer of 2019,’ strength evaporated and prices perched right back down towards that prior low at 1.1509.
But sellers were unable to make much ground thereafter, and prices yet again began to bounce-higher as we traded into a fresh quarter. The net of the past month-and-a-half of price action in EUR/USD was a symmetrical triangle after a pronounced bearish trend, making for a bear pennant formation. With prices now breaking below last week’s swing-low, the door is now opened for a re-test at 1.1509.
EUR/USD DAILY PRICE CHART: SETTING UP FOR ANOTHER SHOWDOWN AT 1.1509
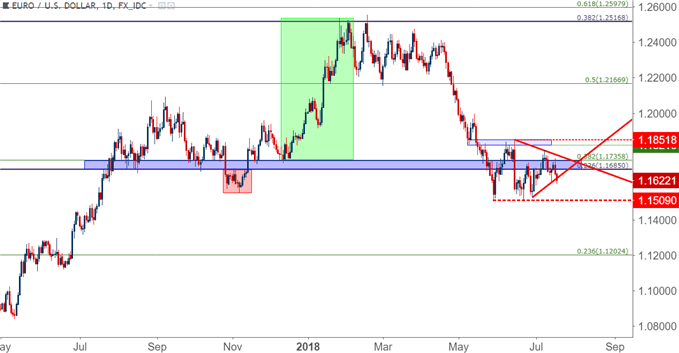
Chart prepared by James Stanley
Disclosure: Do you want to see how retail traders are currently trading the US Dollar? Check out our IG Client Sentiment ...
more

