
US Dollar Falls Through Support, EUR/USD To Post-ECB Highs After NFP
Talking Points:
- Friday morning’s NFP report was somewhat of a mixed bag, but this seemed to do little to help US Dollar bulls as DXY has continued its Q3 descent below support. The likely culprit here was lagging Average Hourly Earnings within this Non-Farm Payrolls report, coming in at .2% versus the .3% expectation.
- Noticeable thus far in the new quarter is the return of EUR/USD strength, and the pair is now trading at a fresh post-ECB high. Prices in the pair have been in a consistent bullish pattern over the past week, and this resembles a similar scenario from last year around the ECB’s October rate decision. When the European Central Bank extended stimulus into 2018, EUR/USD dropped below support and remained bearish for about two weeks. But this was soon offset by a red-hot GDP report out of Germany, and prices were pushing 1.2500 in short-order. Might we be headed for a similar scenario? European inflation came-in at a one-year high in June, and if it keeps up this pace, the ECB may have a difficult time sitting on current rates ‘at least through the summer of 2019.’
NFP AS A MIXED BAG, USD BEARS PUSH BELOW KEY SUPPORT
Friday morning’s NFP report was somewhat of a mixed bag. While the headline number beat expectations, the unemployment rate and Average Hourly Earnings portion of the report did not. Given the intense focus that’s been paid towards inflation out the US recently, that miss in AHE likely took a considerable portion of market participants’ attention around the release, and the net response thus far has been a deeper drop in the US Dollar as the currency continues its Q3 sell-off.
US DOLLAR VIA ‘DXY’ FOUR-HOUR PRICE CHART: SUPPORT BREAK TO THREE-WEEK, POST-ECB LOWS
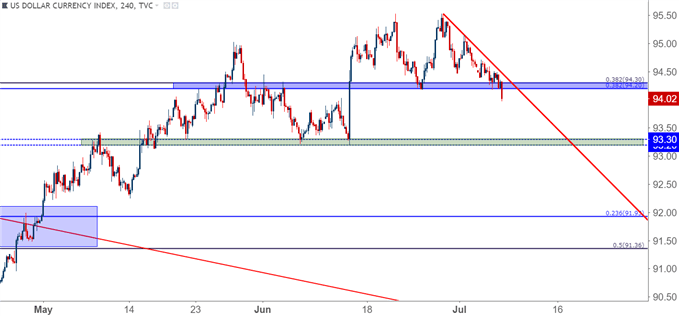
Chart prepared by James Stanley
At this stage, the US Dollar is testing the 23.6% retracement of the bullish move that began in Q2. This does keep the US Dollar in a bullish spot, but given the pace with which losses have shown thus far in the fresh quarter, traders will likely want to move-forward with support or buy the dip strategies with extreme caution. There is a deeper support level that could be a bit more interesting, however, and this runs around the June swing-lows of 93.20 in DXY. This area of prior swing support runs very closely to the 38.2% retracement of the Q2 bullish move.
US DOLLAR VIA ‘DXY’ FOUR-HOUR CHART: DEEPER SUPPORT POTENTIAL AROUND JUNE SWING-LOWS
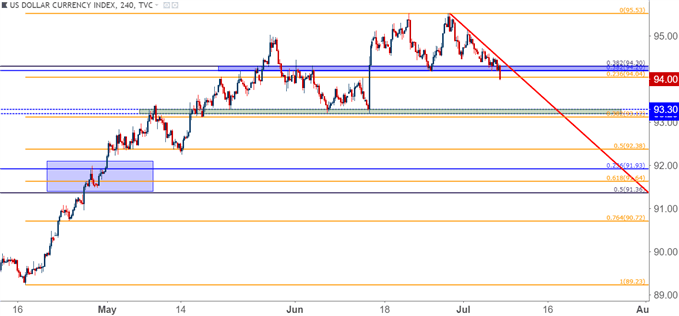
Chart prepared by James Stanley
As mentioned earlier, inflation in the US has become somewhat of a push point to US Dollar price action, and this can likely be drawn back to Europe for a deeper explanation, which we’ll attempt to embark upon a little later. But of note is the fact that US inflation remains strong and continues to rise. Last month saw May inflation numbers print at 2.8%, continuing the trend that started over a year ago when June, 2017 inflation came in at 1.6%.
US INFLATION AT 2.8% IN THE MONTH OF MAY
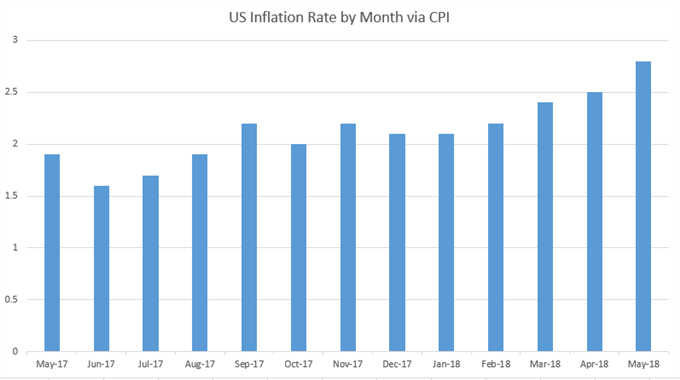
Chart prepared by James Stanley
This is a likely contributor as to why the Dollar is falling despite the headline number beat in this morning’s report. Average Hourly Earnings came in at .2% versus an expectation of .3%, and this makes for a miss on the annualized number, printing at 2.7% versus an expectation of 2.8%. Wage gains are thought of as a precursor to inflationary pressures, and with the Fed remaining persistently hawkish, this does keep them in-line to continue with their rate hike plans in the second-half of this year.
WHY MIGHT USD DROP ON STRONGER INFLATION AND A HAWKISH FED?
Because rates are concerned with future interest rate movements, and after the ECB’s rate decision in mid-June, expectations were very low for any hawkish moves out the European Central Bank. Deductively, this helped to drive capital flows into the US and the US Dollar as the Fed was one of the few games in town for near-term rate hikes. Meanwhile, the Fed remained persistently hawkish as US inflation had remained strong, and this further contributed to that aggressive sell-off in EUR/USD in Q2 as divergence between the two Central Banks appeared to be widening.
But – more recently, European inflation has come back to life, and we saw Euro-Zone inflation for the month of June print at the ECB’s target of 2% for the first time in over a year. This has brought questions to whether the ECB will be able to sit on their current rates ‘at least through the summer of 2019,’ and this has helped to bring EUR/USD back-above 1.1700.
EURO-ZONE INFLATION COMES BACK TO LIFE, HITS ECB’S 2% TARGET IN JUNE FOR FIRST TIME IN OVER A YEAR
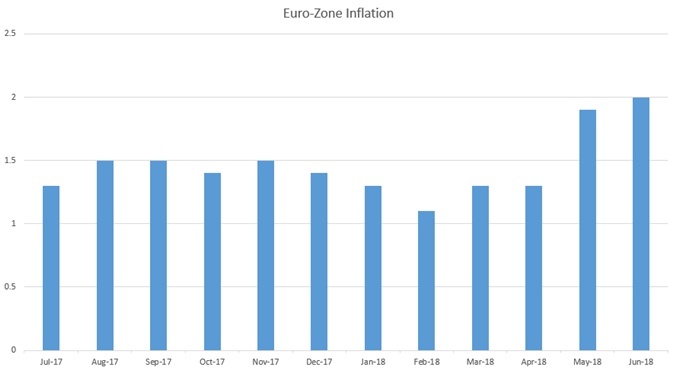
Chart prepared by James Stanley
At this stage, EUR/USD is trading at a fresh post-ECB high, and testing above a key zone of support/resistance that exists from 1.1685-1.1736. Just above this zone is another area of interest that runs from 1.1821-1.1855, and there’s a justifiable argument for bearish continuation until this zone is taken-out. But – if we do see a continued bullish response as we trade deeper into Q3, the door is opened for a re-test of 1.2000 and perhaps even 1.2167 in EUR/USD.
EUR/USD FOUR-HOUR PRICE CHART: TESTING TREND-LINE RESISTANCE AS Q3 COMEBACK CONTINUES
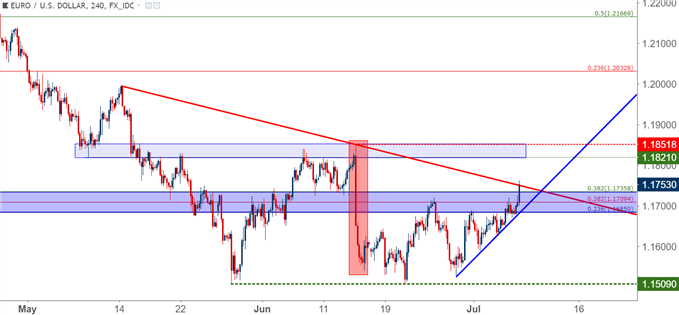
Chart prepared by James Stanley
GROWING POTENTIAL FOR EUR/USD REVERSAL AS WE TRADE INTO Q3
We’ve looked at this a couple of times during our webinars this week, first on Tuesday and then again Thursday; but the scenario that we have here compares well to what happened in EUR/USD in Q4 of last year.
The Euro was strong from April to September, very much driven by the prospect of the ECB a) exiting stimulus and then b) hiking rates. This was such a strong theme that even with the FOMC hiking rates four times in 2017, the Euro continued to show considerable strength against USD. This was somewhat offset in October, however, when the ECB extended their stimulus program into 2018. This helped EUR/USD to finally break-below a key support zone, the same that is currently helping to set resistance, and the pair remained underneath for about two weeks with hints of bearish price action.
This was offset a short two-weeks later. A red-hot German GDP report came-out, and in short-order Euro bulls had returned to the party, and prices were back above the support zone ahead of another run towards fresh highs at 1.2500.
EUR/USD DAILY: OCTOBER, 2017 ECB BRINGS TWO WEEKS OF WEAKNESS, SOON OFFSET BY RETURN OF STRENGTH
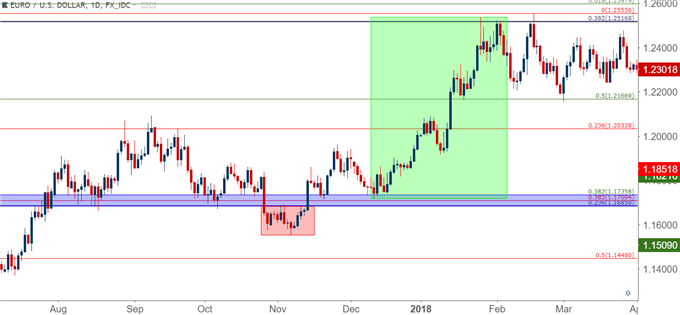
Chart prepared by James Stanley
More recently, a bearish theme developed in the Euro in Q2 as driven by a combination of a) weaker European data b) rising political risk in Italy and then Germany and c) a dovish ECB in response to a and b. Prices once again slid below this key zone of support around that ECB rate decision, but sellers were unable to make any ground below the prior May swing-low. As European data has started to show initial signs of improvement via inflation, prices have re-engaged above support, and buyers are continuing to push higher.
So, even though the Fed is more-hawkish than the ECB and we’re likely going to be seeing more near-term rate hikes out of the Fed than the ECB – this does not preclude EUR/USD strength, much as we saw last year. Instead, focus on price action, and if bulls are so confident that they’re willing to trade through the June swing-high, the door re-opens for topside strategies in the single currency as we trade deeper into 2018.
EUR/USD DAILY CHART: EURO WEAKNESS BELOW SUPPORT SHORT-LIVED, REDUX OF OCTOBER, 2017?
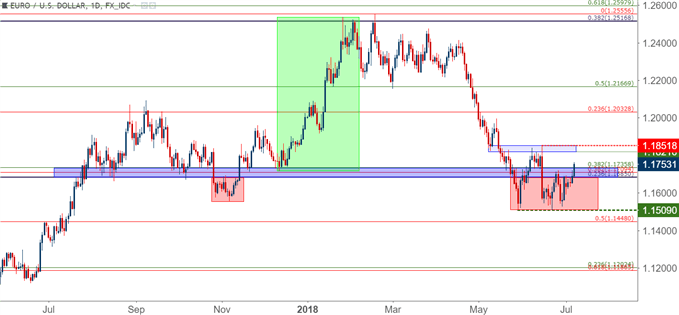
Chart prepared by James Stanley


