Trading Support And Resistance - Sunday, June 24
This week we’ll begin with our monthly and weekly forecasts of the currency pairs worth watching. The first part of our forecast is based upon our research of the past 16 years of Forex prices, which show that the following methodologies have all produced profitable results:
-
Trading the two currencies that are trending the most strongly over the past 3 months.
-
Assuming that trends are usually ready to reverse after 12 months.
-
Trading against very strong counter-trend movements by currency pairs made during the previous week.
-
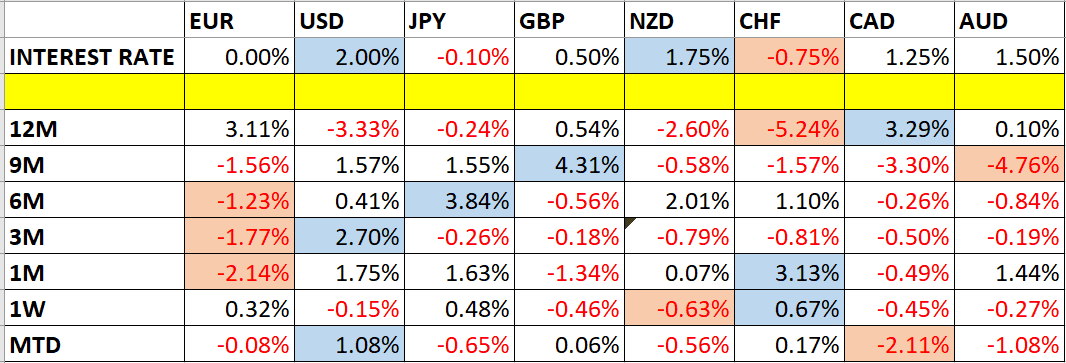
Buying currencies with high interest rates and selling currencies with low interest rates.
Let’s take a look at the relevant data of currency price changes and interest rates to date, which we compiled using a trade-weighted index of the major global currencies:
Monthly Forecast June 2018
For the month of June, we forecast that the best trade would be long USD/SEK. The performance so far has been positive, as shown below:
|
Currency Pair |
Forecast Direction |
Interest Rate Differential |
Performance to Date |
|
USD/SEK |
Long ↑ |
2.50% (2.00% - -0.50%) |
0.41% |
Weekly Forecast 24th June 2018
Last week, we made no forecasts, as there were no strong counter-trend price movements.
This week, we forecast the USD/MXN currency pair is likely to rise in value.
This week has been dominated by relative strength in the Swiss Franc, and relative weakness in the New Zealand Dollar.
Volatility was lower last week, with 19% of the major or minor currency pairs changing in value by more than 1%. Volatility is likely to be similar over the following week.
Previous Monthly Forecasts
You can view the results of our previous monthly forecasts here.
Key Support/Resistance Levels for Popular Pairs
We teach that trades should be entered and exited at or very close to key support and resistance levels. There are certain key support and resistance levels that should be watched on the more popular currency pairs this week, which might result in either reversals or breakouts:
|
Currency Pair |
Key Support / Resistance Levels |
|
AUD/USD |
Support: 0.7403, 0.7374, 0.7343, 0.7309 Resistance: 0.7453, 0.7479, 0.7510, 0.7580 |
|
EUR/USD |
Support: 1.1629, 1.1596, 1.1496, 1.1467 Resistance: 1.1709, 1.1732, 1.1875, 1.1897 |
|
GBP/USD |
Support: 1.3218, 1.3155, 1.3112, 1.3057 Resistance: 1.3309, 1.3350, 1.3482, 1.3521 |
|
USD/JPY |
Support: 109.60, 109.07, 108.05, 107.49 Resistance: 110.20, 110.85, 111.41, 111.75 |
|
AUD/JPY |
Support: 80.42, 79.99, 79.35, 76.59 Resistance: 81.90, 83.28, 83.65, 84.54 |
|
EUR/JPY |
Support: 127.11, 126.35, 125.60, 124.71 Resistance: 128.97, 129.56, 131.61, 132.57 |
|
USD/CAD |
Support: 1.3254, 1.3142, 1.3047, 1.2826 Resistance: 1.3362, 1.3464, 1.3500, 1.3540 |
|
USD/CHF |
Support: 0.9827, 0.9679, 0.9500, 0.9384 Resistance: 0.9908, 0.9936, 0.9985, 1.0005 |
Let’s see how trading one of these key pairs last week off key support and resistance levels could have worked out:
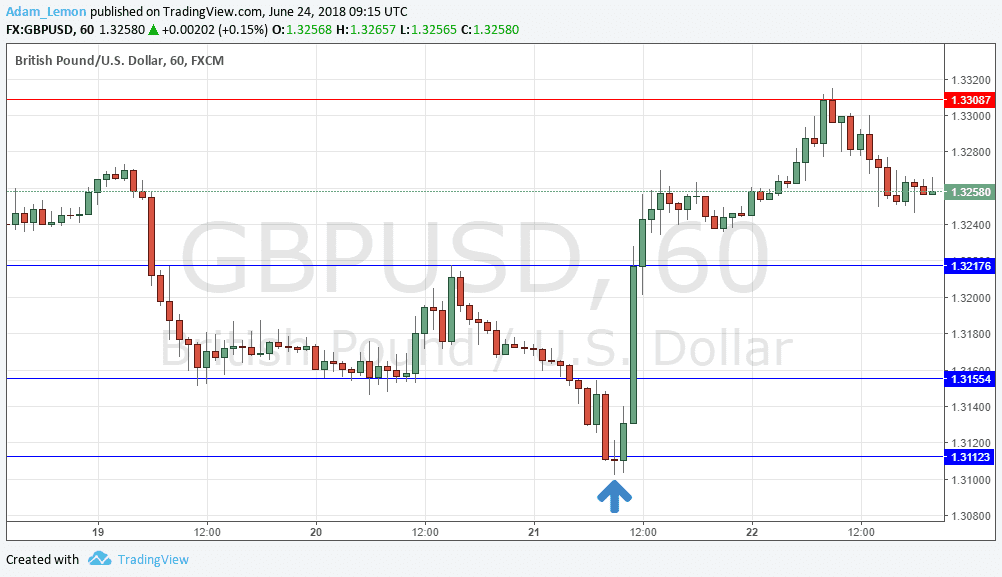
GBP/USD
We had expected the level at 1.3112 might act as support, as it had acted previously as both support and resistance. Note how these “flipping” levels can work well. The H1 chart below shows the how the price hit and rejected this level during the early part of the London session last Thursday, a time of day which is often good for entering trades in European currency pairs such as this one. Although the rejection happened a few pips below the level of 1.3112, it usually pays not to be overly precise about that if the price action is good, and we saw here a very obvious doji candlestick which often signifies a good reversal is about to take place. Due partially to the smallness of the entry candlestick, this trade has been very profitable, achieving a maximum positive reward to risk ratio so far greater than 9 to 1.