
The US Not Alone In Being Oversold
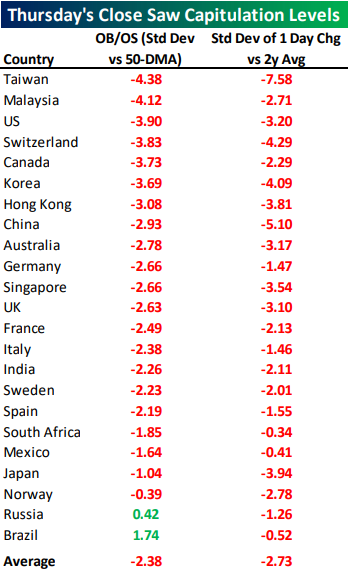
It is no secret that the US has become extremely oversold in the past week, but this weakness extends well outside of our own borders. With the worst of the selloff occurring last Thursday, declines were widespread and extreme. The table below shows the Overbought and Oversold readings of global equity benchmarks for the 23 countries from our Global Macro Dashboard. Of the group shown in the table, the average Overbought/Oversold reading as of the close Thursday was 2.38 standard deviations below their 50-DMA. A majority were even more than this average as seven of these countries had readings below negative three standard deviations.
Relative to their daily price action over the past two years, Thursday’s collapse was even more remarkable. The 23 countries shown were all down with an average move of 2.73 standard deviations for the day. Taiwan led this average down an astounding 7.58 standard deviations. There is no way to sugar coat how bad Thursday was for global equities.
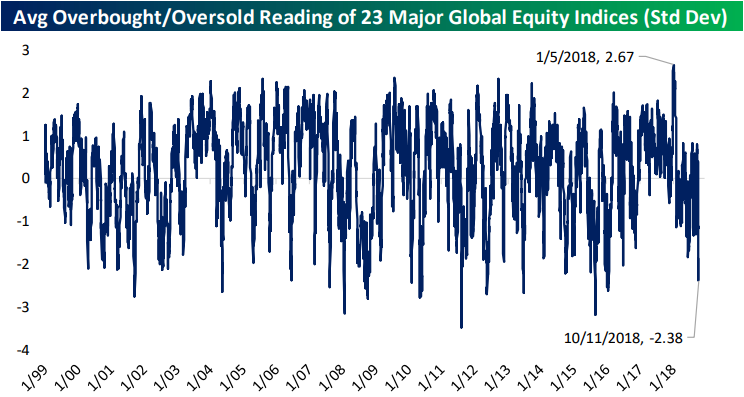
With a longer time horizon, Thursday’s move was not the worst in the past 20 years. There have been sessions in which global equities collectively closed at more oversold levels. Thursday was the worst since January 2016 when global markets were trying to cope with the FOMC’s first rate hike following zero interest rate policy. Also worth noting is that many of these equity benchmarks are coming from a different place than the US.US equity markets are coming off of very recent bull market highs, conversely, the rest of the world has been trending lower.
Disclaimer: To begin receiving both our technical and fundamental analysis of the natural gas market on a daily basis, and view our various models breaking down weather by natural gas demand ...
more

