
The Canadian Bond Market Gives A Totally Different Reading Of The Economy
Canada has become one of the fastest growing economies in the developed world. The IMF in its most recent forecast notes that “there has been a very strong data release on monthly GDP in early 2017 for Canada, which bodes very well for growth in the early part of the year.”[1] GDP grew at an annualized pace of almost 4 per cent in the first quarter, according to the Bank of Canada. That’s the fastest growth among other G-7 economies.
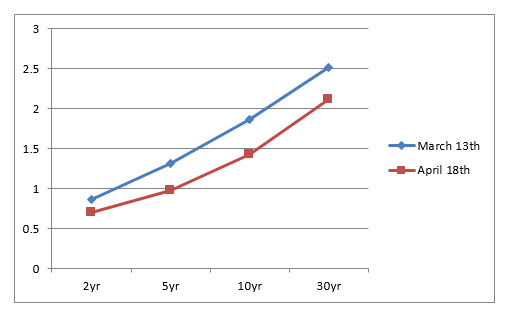
One would expect that this robust start to the year would turn the head of bond investors in the direction of higher rates. So why has the bond market, across the entire yield curve, moved in exactly the opposite direction? Chart 1 maps the shift in the Canadian yield curve within the last 35 days, during the same time period that the economy was expanding rapidly. Specifically, the yield on a 2yr bond dropped 17 bps, yields on 5 yr bonds 35 bps and the yield on the 10 yr bond fell by 44 bps. These are dramatic shifts especially given that there was no external shock to the financial markets that would explain the rush to buy Canadian bonds.
Chart 1 Canadian Bond Yields Take a Dramatic Shift Downwards
Bond investors are always on the lookout for changes in the underlying conditions that would put current yields at risk. So, how have risk factors changed in such a short time that turned the head of bond investors so quickly? A few observations may provide some answers:
- U.S. economic performance has been muted in the first quarter of 2017; forecasters expect a weak quarter with GDP coming in around 1 per cent; accordingly, the U.S. Treasury yields have tumbled in response to these dimmer growth prospects.
- The initial euphoria surrounding the election of Trump has abated considerably and the so-called ‘reflation’ trade, where equity and bond prices diverge, is now in the process of reversing itself.
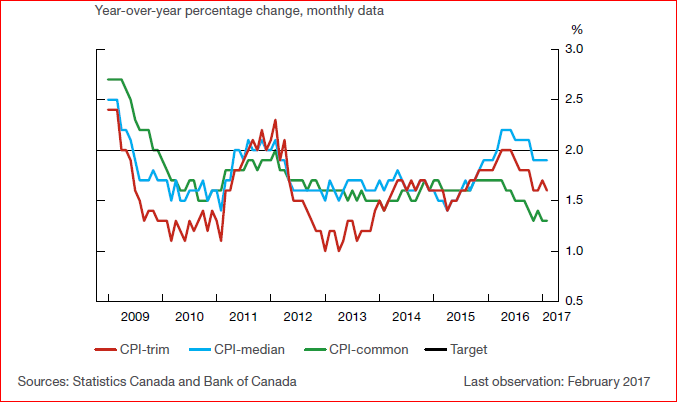
- Inflation and inflationary expectations have moderated considerably; Chart 2 details how the Bank of Canada’s preferred measure of inflation has drifted down in recent quarters and remains below 2 per cent; although energy prices have boosted inflation in the first quarter, their effects are expected to be temporary.
Chart 2 Various Measures of CPI in Canada
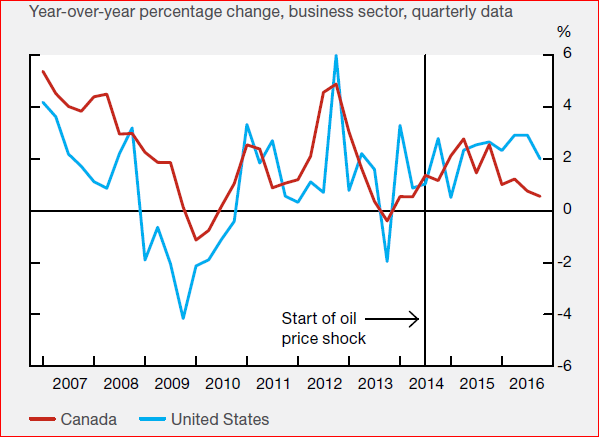
- There remains considerable slack in Canada’s labour market; Chart 3 compares the unit labour costs in Canada and the United States; growth of unit labour costs in Canada has declined since mid-2015. The weakness in labour costs has contributed to reducing the growth in core inflation in both countries, but more so in Canada’s case.
Chart 3 Growth in Unit Labour Costs in Canada and the United States
- Canadian business investment has been a major disappointment since the global financial crisis starting in 2008; the outcome for investment remains very cool and this will moderate growth for the next couple of years; and, finally,
- The election of President Trump initially sent a cold shiver down the spine of Canadian policy makers; the prospect of a dramatic shift toward global protectionism introduced a degree of uncertainty not seen in several decades; however, the Trump administration has walked back several major items on its economic agenda; there is now growing opposition with the Congress to Trump`s protectionist policies, such that the initial concern in Canada has abated somewhat.
In sum, although the first quarter of 2017 started on a very positive note, the underlying conditions continue to favour low and possibly lower interest rates for the balance of 2017.
[1] Gian Maria Milesi-Ferretti, IMF deputy director of research
Disclosure: None.


