
Tadawul All Share Index (TASI) Signals A Temporary Top
Given the recent behavior of the Tadawul All Share Index (TASI) (Saudi Stock Exchange), a deeper retracement seems likely before the index is ready to resume its uptrend.
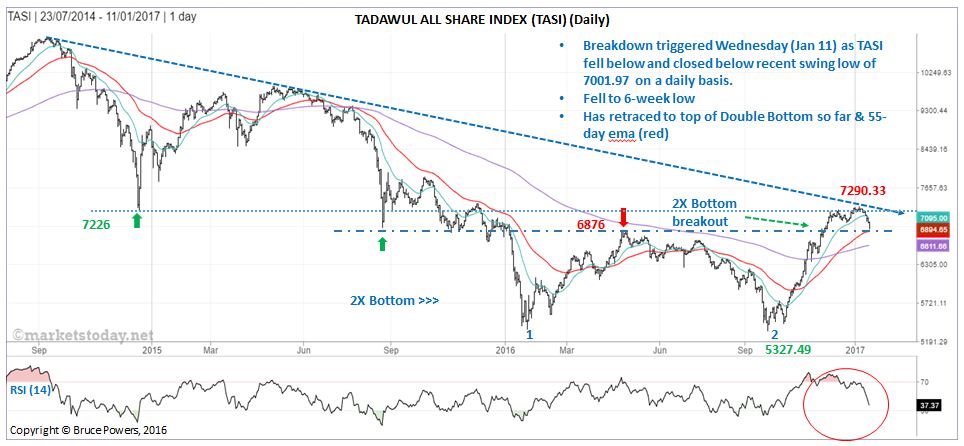
The bigger picture includes some bullish signs but in the short-term the index is signaling a reversal of the most recent uptrend. That uptrend, beginning from the 5,327.49 low hit 14 weeks ago, led to a 36.8% advance as of the 7,290.33 high hit last week.
Six weeks ago the TASI broke out of a relatively large double bottom trend reversal pattern and momentum persisted following the breakout. Volume remained relatively high during the subsequent week. This trend strength was confirmed by the bullish signal of both the 21-day and 55-day exponential moving averages (ema) crossing above the 200-day ema.
This week the index moved into a clear retracement, falling below the 21-day ema support and below the most recent swing low (four-week low) as momentum picked up, while the 14-day Relative Strength Index (RSI) accelerated its decline.
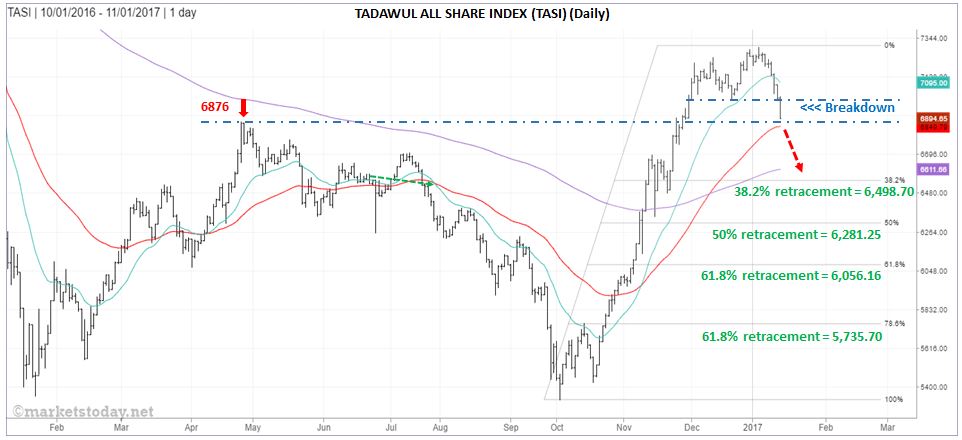
Price areas to watch for potential support include the key Fibonacci retracement levels. They have changed slightly from the price levels mentioned in the last TASI technical update from December 22nd – here –as the index exceeded the high slightly following publication.
Retracement targets include:
-6,611.66 = Current value of 200-day exponential moving average
-6,498.70 = 38.2% Fibonacci retracement
-6,281.25 = 50% retracement
-6,056.16 = 61.8% Fibonacci retracement
-5,735.70 = 78.6% Fibonacci retracement
Disclaimer: The views and opinions expressed here are solely those of the authors / contributors and do not necessarily reflect the views ...
more

