
Report For Week Ending Dec. 9: Geometry Of Global Financial Markets
HIGHLIGHTS
- Bitcoin: Hits a significant upside target, but rally may still have legs.
- US Dollar: Clears key resistance and heading higher, following bounce off key circle support.
- Gold: Next key area to watch for key support is around $1,215 to $1,201.
BITCOIN (XBT/USD)
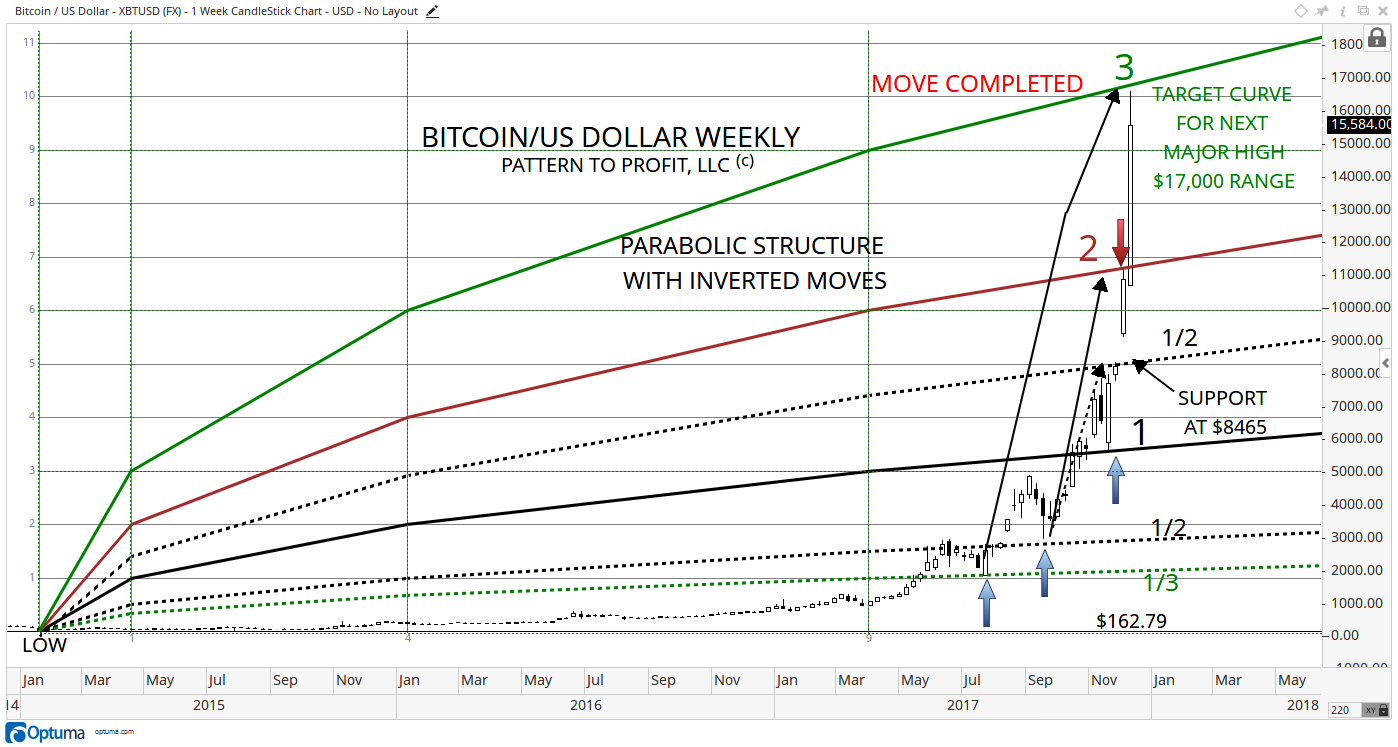
- Bitcoin essentially hits target discussed last week, seen in the parabolic structure.
- A rally with conviction into new high territory will lead to a target of $24,340 on December 13. This may be realistic when considering the parabolic nature of the larger uptrend.
- Key near-term support levels seen in the geometry.
Bitcoin saw another dramatic week higher last week, topping out at $16,613.50 (Optuma price. Due to volatility data providers have recorded a number of different high prices for the week.) and completing the inverted move predicted in the weekly parabolic structure analysis we published on December 1, 2017. Here is the updated weekly chart:
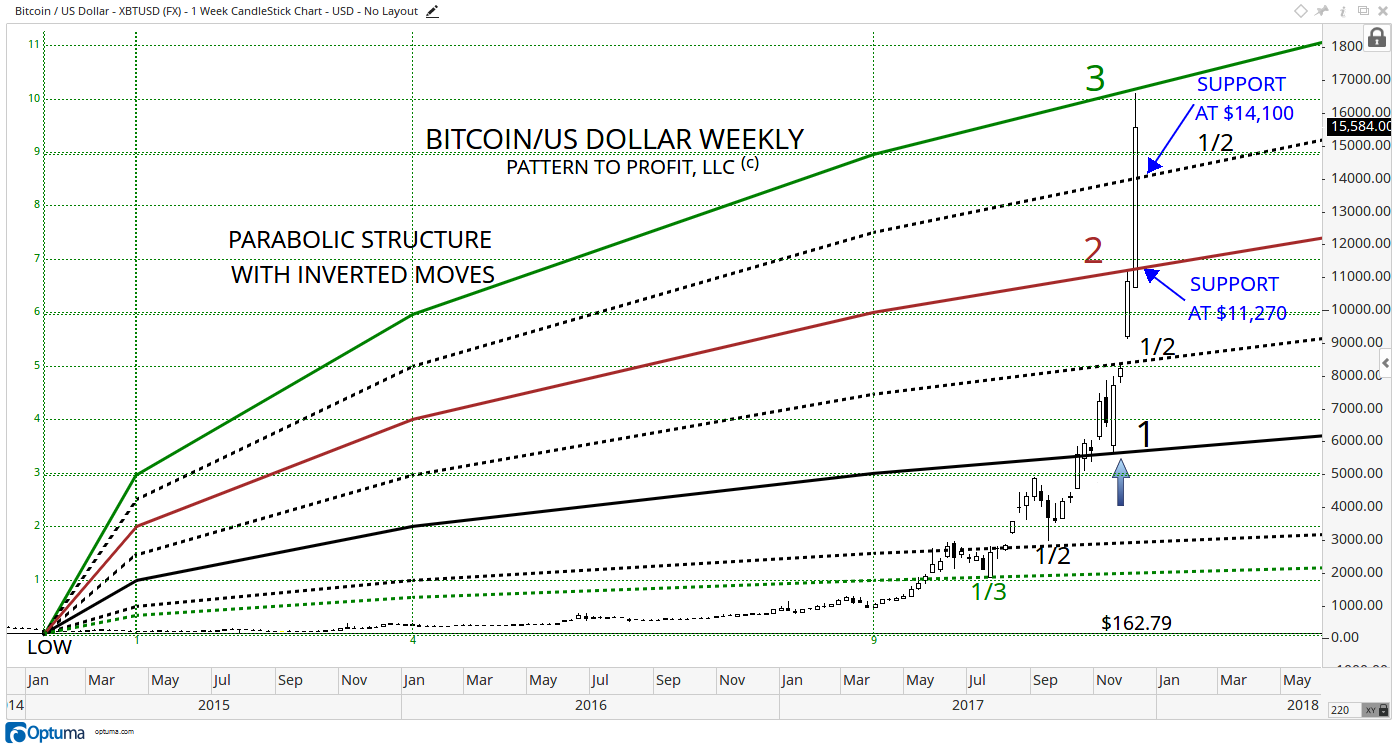
The market is expected to drop to a related support curve below, within the parabolic structure. Curves 2.5 and 2 should provide the more significant potential support zones on a drop, to around $14,100 and $11,270, respectively:
Turning now to a daily chart for greater detail, the vector concentric circles analysis provides an accurate support curve identifying the preceding two lows over the past two weeks, on November 24 and 30. This coming Monday’s support level is at $12,850, and leads up to Thursday’s support at the circle intersection of $14,300. That roughly aligns with weekly support of $14,100 that was seen on the preceding daily chart. When two or methods identify a similar price level, the price area should be given extra consideration.
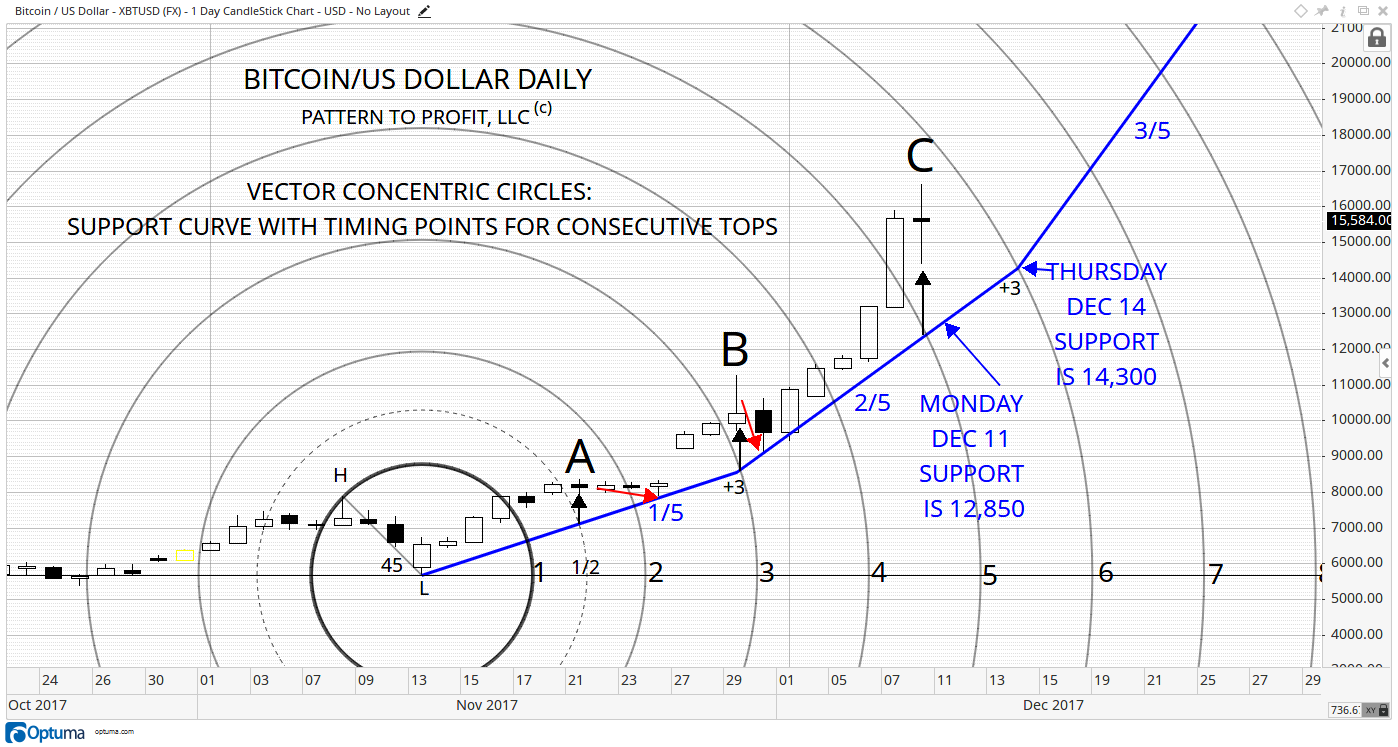
The vector concentric circles are formed from setting the downtrend vector at 45o (marked H-L). The support curve is formed by a succession of fractionally related angles moving forward (and backwards if needed) by a specific pattern of circles. In this example, a 1/5 angle (1/5 of 90o, or 18o) is drawn from the center outward by three full circles (+3 at a time), increasing by 1/5 each time as well.
Note the highs at A & B, directly above the support curve intersecting concentric circles 1.5 & 3. The current potential top at C is also above the intersection below, and this observation strengthens the likelihood of at least a minor top forming with a subsequent drop back down to some level of support.
To identify the entire uptrend so far, including matching resistance to the support curve, a similar curve is started from the vector high, but proceeding only two circles at a time (+2). The resulting funnel-like shape is rather definitive for this ensuing uptrend:
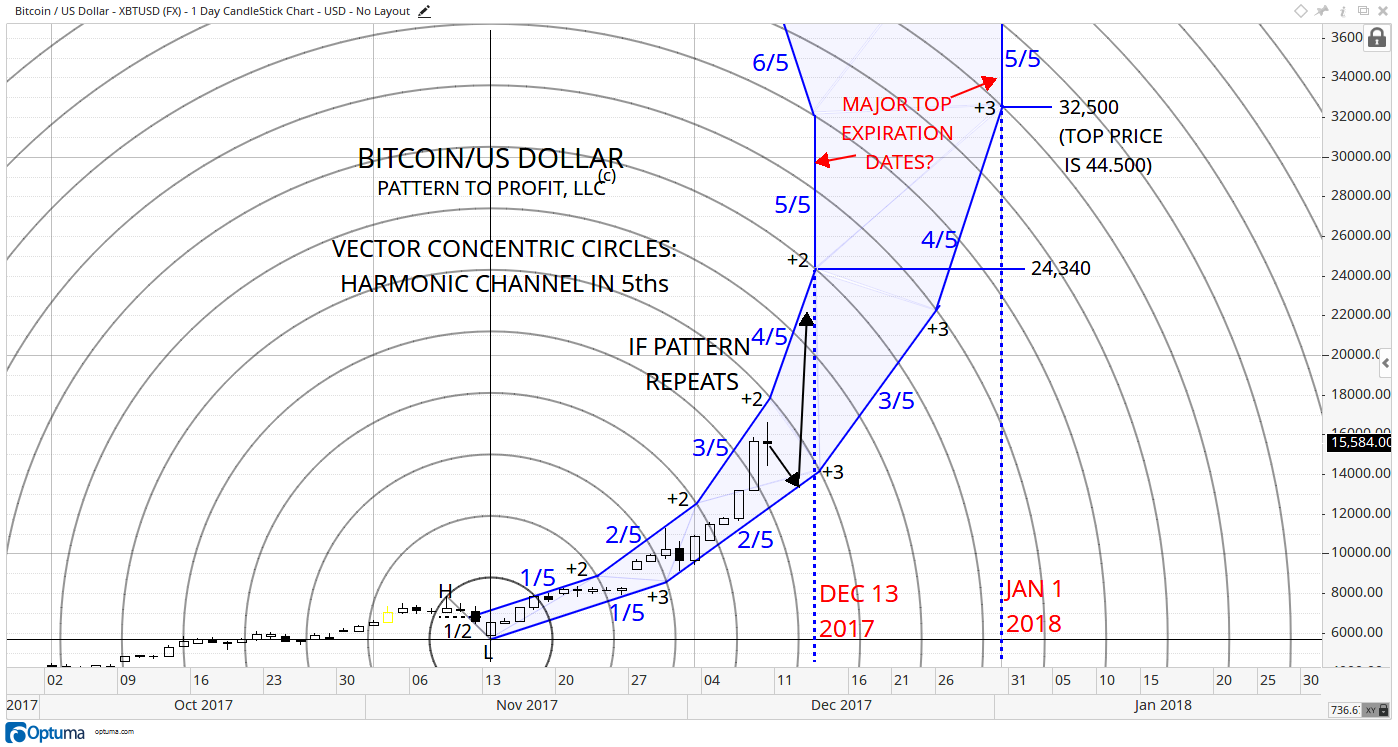
The market will eventually cross through the two periods identified by the channel’s vertical section, on this Wednesday, December 13, as well as January 1, 2018. If in the event Bitcoin is rallying strongly into new high territory, then the initial target of $24,340 on December 13 is realistic, considering the parabolic nature of the larger uptrend. With a sustained uptrend, the next target of $32,500 is on January 1, 2018. That upper price level is highly ambitious, yet not out of the question.
US DOLLAR INDEX (DXY)
- Clears key resistance to ensure uptrend.
- Geometry shows next “aggressive” target of $97.874 for January 2, 2018.
The dollar is making a rather admirable refutation to the decline starting from 103.82 on January 3, 2017, by clearing above the general support range of 92.00 – 93.00 from the preceding lows of May 3 and June 23, both in 2016.
As mentioned in the last analysis on the dollar, published on December 1, the dollar needed to clear daily resistance of 93.188 to trend higher. Here is the updated chart showing a sustained break above said resistance following a bounce off circular support:
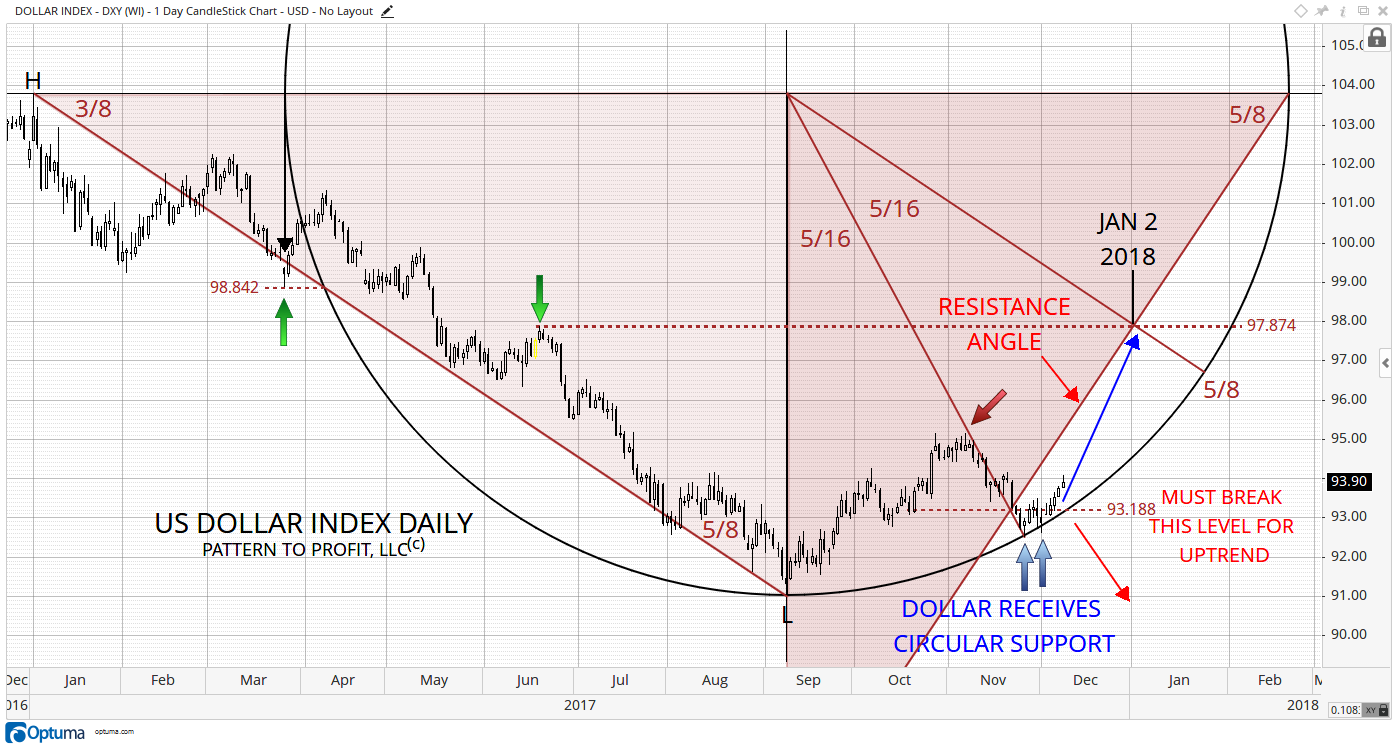
Indeed, circular support seems intact and the dollar appears safe from another devastating drop (at least temporarily). However, the lofty goal of reaching 97.874 by this coming January 2, 2018 as seen in the geometry seems unrealistic, particularly given the absence of a strong bullish candle last Friday (close is significantly higher than the open). Nevertheless, the timing point does closely align with the January 1, 2018 date from the bitcoin daily analysis. Consequently, we are expecting at least a short-term reversal in both markets around the beginning of the New Year.
To observe how this recent activity discussed above fits into the larger picture, let’s back up to a weekly view. Considering the preceding major downtrend as well, harmonic channels are drawn both forwards and backwards from a central downtrend (marked H-L, this time set to 1/4 of 90o) demonstrating a much greater harmonic system of support and resistance. The current market seems humbled by retrospect, and is clearly at a major decision point:
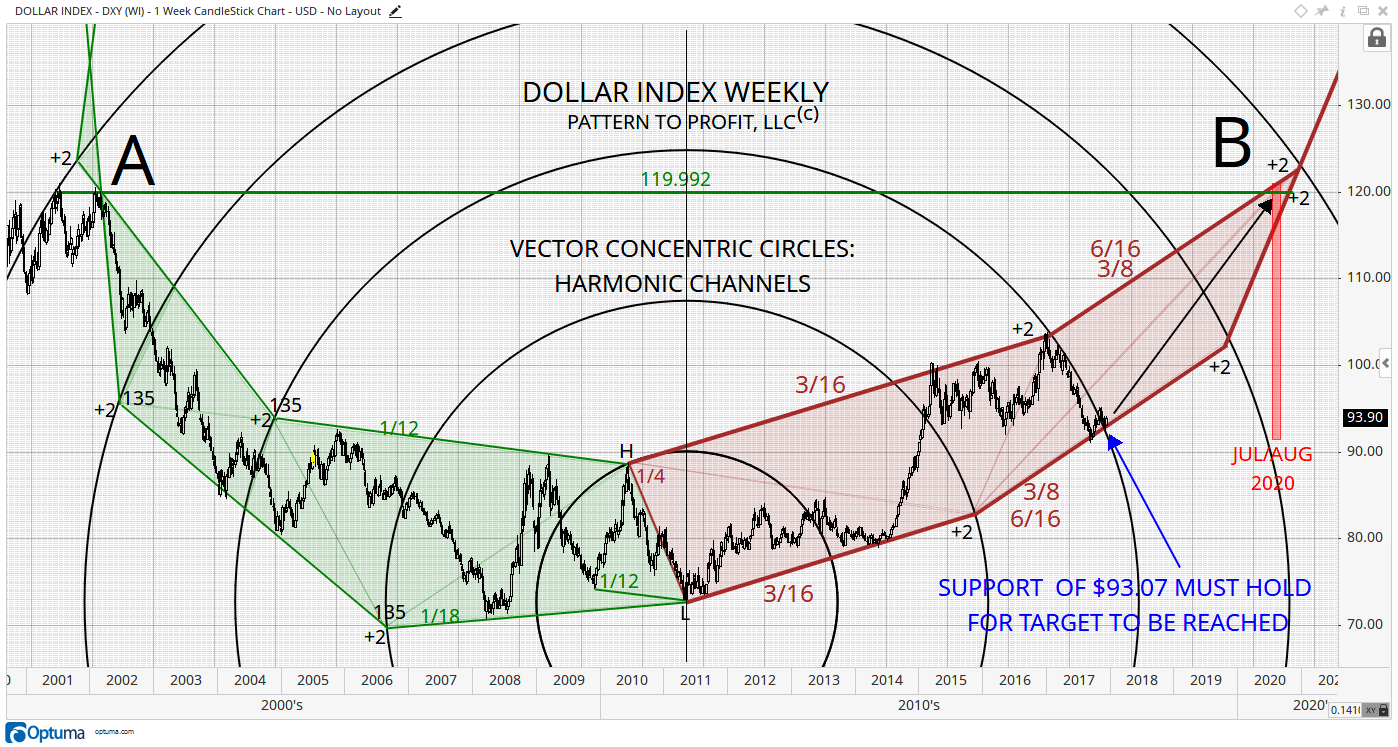
In geometric charting, harmonic relationships exist in both directions of time. Notice the 3rds channel (green) stemming back in time form the downtrend vector (H-L) starting with 1/12 from the vector high and 1/18 from the vector low, each moving 2 concentric circles at a time, and employing the important angle of 135o (or the crucial 45o x3). They meet up at point A, where the first top (going backwards) occurred. The resulting intersection provides the resistance level of 119.992 (green horizontal), which intersects the forward channel (brown) just beneath its corresponding intersection at B. The reversal months of July/August 2020 (see Weekly Report Vol. 1, November 6, 2017) are a perfect addition to this alignment area (red rectangle).
The master support and resistance channels presented here clearly dictate the current market opportunities: begin the next intermediate uptrend, or continue the prevailing intermediate downtrend and producing an overall major downtrend in doing so. Note the dollar’s respect of the concentric circle defining the entire 2017 downtrend. Since the market is now just barely outside this circle and above support, perhaps it might be free to pursue the long upward journey to point B. Support for this coming week of December 11 is 93.07, and it must hold for higher highs to commence. The level of 93.188 from the preceding chart is a mere 0.118 points away, forming an important zone of support through this coming week.
GOLD (XAU/USD)
- Next support zone is lower, from approximately $1,215 to $1,201.04.
- Lower price level must hold for two-year uptrend to be sustained.
- Otherwise, the $1,046.23 swing low is at risk.
Last week, on both Tuesday and Wednesday, December 5 and 6, gold had successive closing prices below daily support of $1,273.195. This was initially discussed in our November 25 weekly report. This price action was a confirming bearish signal, and was followed by lower closes on the next two days closing out the week.
Again, severity of daily activity must be assessed from a larger perspective:
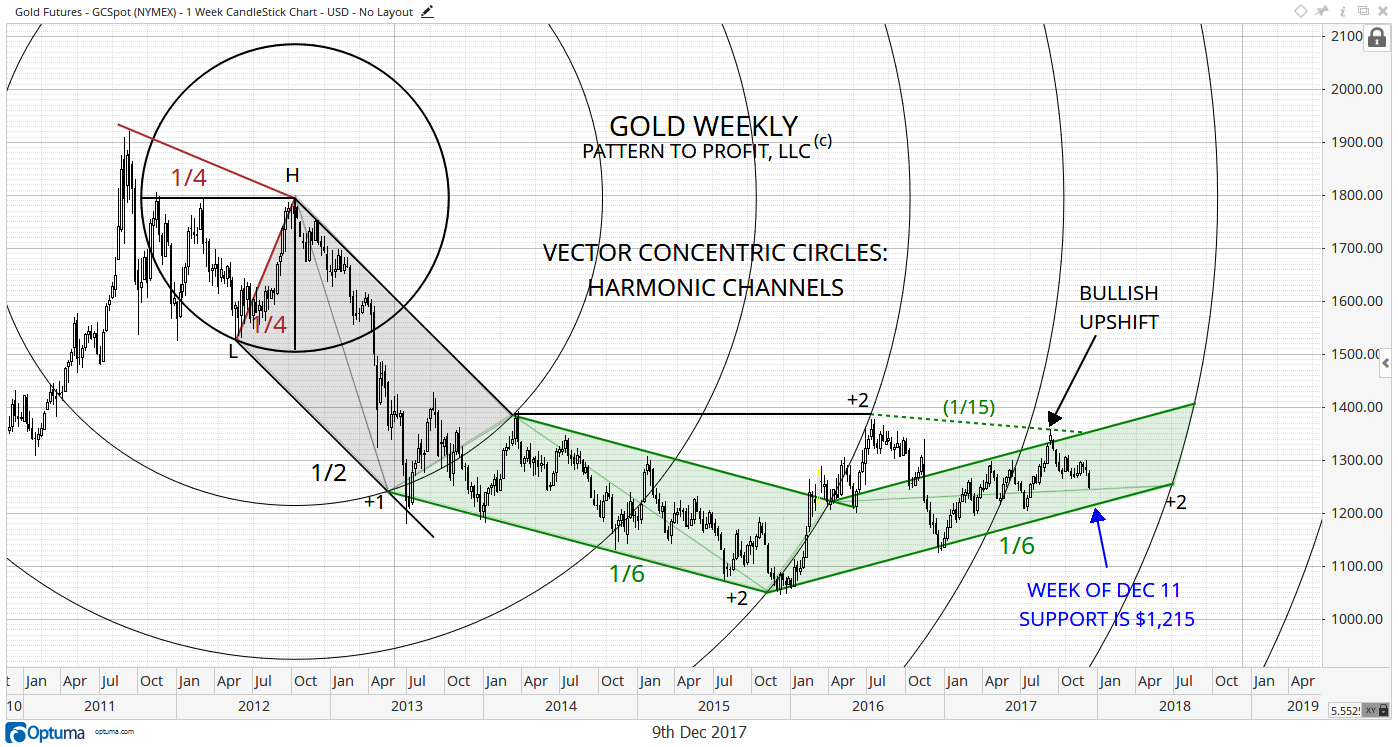
This harmonic channel starts off as 45o from the vector high and low out to the 2nd circle (grey shaded), then a 1/6 channel going out +2 circles, descending and ascending (green).
The current market decline is a very reasonable drop back down to channel support given at $1,215 for this coming week, and aligning with the downside support level of $1,213.20 from the daily analysis of the prior week.
The following chart displays two intricately related geometries present in the overall downtrend since the all-time high of September 6, 2011. Two perfectly conforming triangles (green) are present from this setup (A, B, & C, and a, b & c). The current market is respecting both, as it consolidates in between them at c.
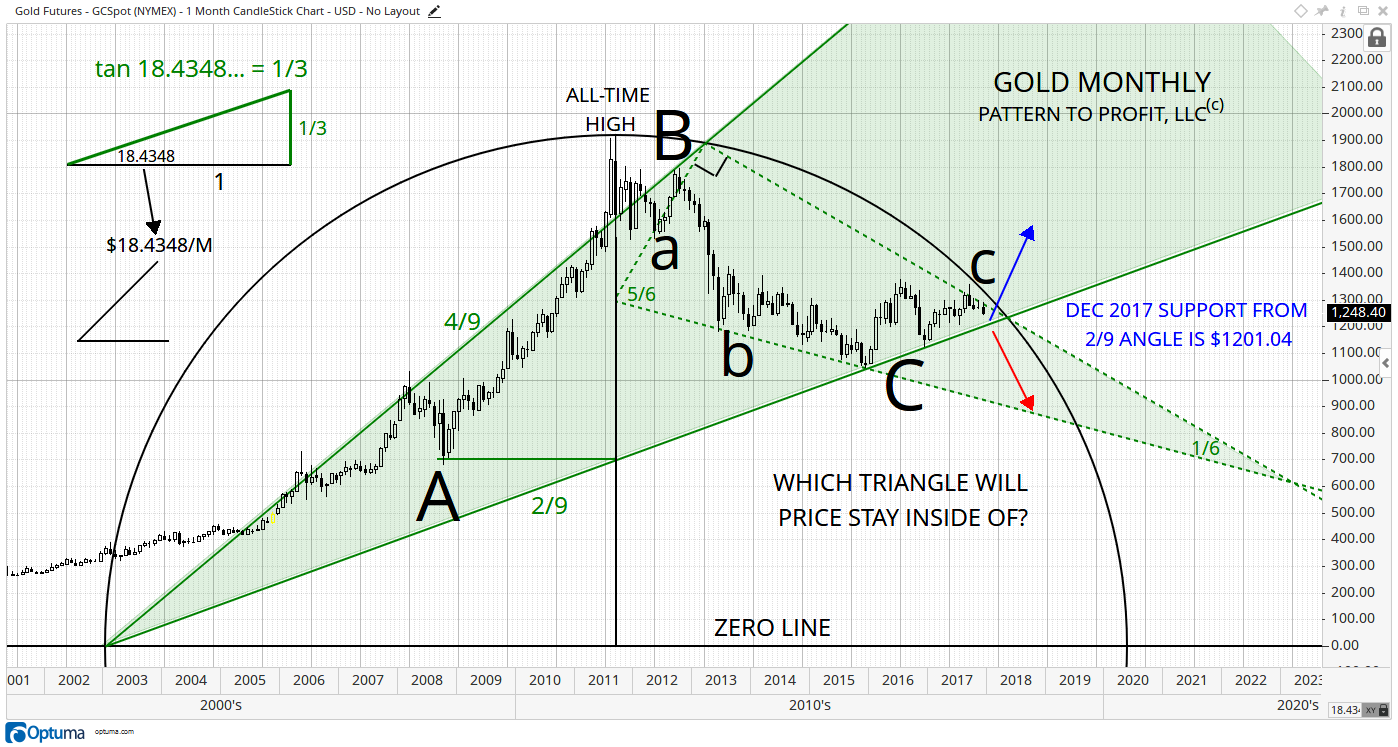
This analysis utilizes three techniques to arrive at the basic setup.
- Firstly, the special angle of 18.4348o (its tangent ratio is exactly 1/3) is converted directly to points per month (18.4348/M) to set the vital price/time ratio and basis for geometry.
- Secondly, a Zero Line is employed, (borrowed straight from W.D. Gann).
- Thirdly, a vector circle is drawn using the all-time high’s square point (the high’s month of September 2011 intersecting with zero) as the center of a circle whose radius goes right up to the all-time high.
At point C, the 2/9 angle offers accurate support for the preceding two lows, acting as a pre-existing trend line (as opposed to needing both lows to draw the trend line). The current monthly support level offered by this angle is $1201.04. If the market drops below this level then we expect a drop down to lower support (red arrow) to the $873 - $900 range. Good to note that gold is not expected to break below the previous all-time high of $873 in January 1980, which serves as major support.
Disclosure: Pattern to Profit, LLC, any affiliates or employees or third party data provider, shall not have any liability for any loss sustained by anyone who has relied on the information ...
more

