
Pound Sterling’s Prospects - Seeing Through The Brexit Fog: Update
Background to my long term analysis of GBP/USD, please see my earlier article: Pound Sterling’s Prospects – Seeing Through The Brexit Fog
The above article was published just prior the Bexit Referendum vote in 2016. Since then, a lot has taken place, providing a measure of clarity on many complex issues associated with the event.
Gaining Royal Assent to enable Prime Minister May to formally trigger Article 50 by scheduled on 29th May 2017, however, will not be an end in itself.
Subsequent negotiations required to finalize the agreement are likely to take a significant amount of time. Calls for a second referendum by Scotland’s First Minister for their independence will also affect the “Sterling’s Prospects”. As we see its prospects fluctuate during this time, we can expect a clear recognizable trend to emerge on the upside
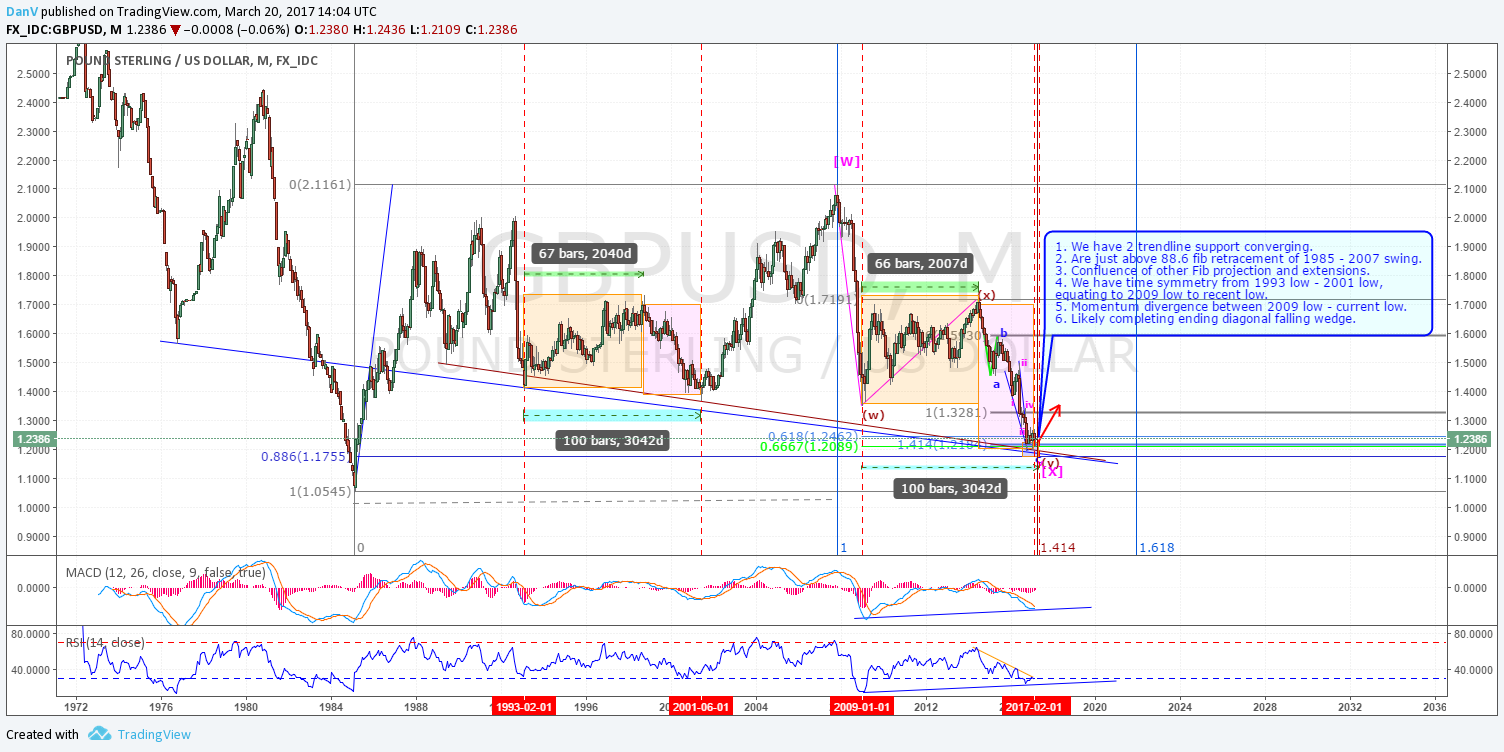
Here is the summary of supporting technical observations from the above chart:
1. We have 2 trend-lines converging to support a zone, namely Oct 1976 to Jan 1993 and another from June 1989 low to May 2001.
2. Above 88.6% fib retracement of 1985 low to Nov 2007 swing.
3. Confluence of other Fib projections and extensions such as:
a. The Nov 2007 high to Jan 2009 low projected from June 2014 high is approx 2/3rd (66.67%) to Oct 2016 low.
b. June 2014 high to April 2015 low projected from June 2015 is approximately 141.4% to Oct 2016 low, etc.
4. We have time symmetry from the 1993 low - 2001 low, equating to the 2009 low to recent low along with others which are approximately equal, as shown on the chart.
5. Momentum divergence between 2009 low with current low both on monthly and weekly time-frames.
6. In the previously published chart (referred to above), I labelled the entire decline from Nov 2007 as “ABC”. However, it seems that it might be better labelled as “WXY” (i.e. a double zigzag). Under this assumption, we have an “ABC” decline from July 2014. Wave “C” of this second zigzag forms an ending diagonal (falling wedge).
7. On a daily time-frame, we could also see a possible triple bottom, which, accompanied by Commitment of Traders reporting for the last 2 weeks, increases net short positions by speculators.
8. Seasonally, GBP/USD tends to do well overall between March and July
Conclusion:
If the above are true, then, we have retraced the entire move up from 1985 to 2007 by 78.6% - 88.6%. This observation, along with the other technical observations noted above, could suggest that a meaningful low in this pair has been posted. This could offer us an opportunity to use temporary weaknesses in the GBP/USD to make the most of a longer term bullish cycle which is likely to develop over several months, if not years.
Disclosure: As always, please do your own due diligence and analysis for your requirement.


For who are interested - I have posted some additiona charts and details to above updates which you can read at this link:
www.tradingview.com/.../KLQbZmMj-POUND-STERLING-S-PROSPECTS-SEEING-THROUGH-THE-BREXIT-FOG-UPDATE/