
OPEC And Friends Production Cut Exceeds Expectations, Crude Rallies
FUNDAMENTAL FORECAST FOR USOIL : BEARISH
FUNDAMENTAL CRUDE OIL PRICE TALKING POINTS:
- The ONE Thing: After little progress appeared on Thursday, OPEC emerged on Friday with an agreement to cut 1.2 million barrels per day by OPEC and strategic alliances. The market was shifting to expect a lower bpd cut, so the final number was welcome news, and crude rallied as a result.
- Crude rallied 5% on the news release on Friday morning alongside another encourage US payroll report. WTI remains 11% lower YTD & 10% lower over the last 20 days. Brent is lower 6% YTD.
- Crude returned to Contango indicating signs of oversupply. The new December 2019-2020 spread shows the market trades around Contango and backwardation. While OPEC may bring about a bounce, the damage appears to be done, and if anything, the actions from OPEC+ may simply allow a range to develop in the market.
- Per BHI, U.S. total rig count falls one rig to 1075 from 1076; US Oil rigs fall by ten to 877
A larger than expected production cut has given crude bulls all they wanted for Christmas, a reprieve of the massive selling. Crude jumped ~5% on larger-than-expected production cuts, which has had ripple effects to equity markets that were still open after the news broke of an agreed-upon 1.2m bpd cut after expectations were faltering that the previously expected cut would be reached.
The question now remains, how long can the OPEC+ buzz last?
Looking to fixed income, there is trouble brewing in the belly of the US Treasury curve, which indicates increased doubt about further growth (i.e., demand for oil) that could mean Friday’s reprieve lasts nowhere near as long as hoped.
WHY OPEC (AND FRIENDS) STILL MATTER TO MARKETS
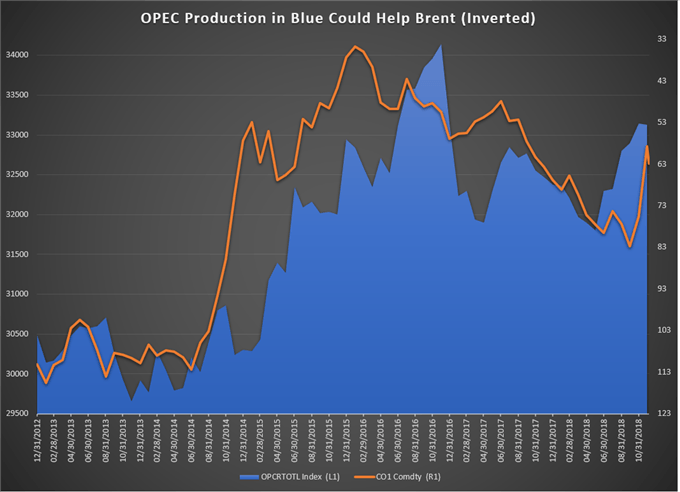
The chart above has OPEC total production back to 2012 with an inverted overlay of Brent crude. A helpful way to see the chart with inverted Brent is that when production increases, the price of oil drops (although it moves higher on an inverted chart.)
The cut today takes the current total production from OPEC from 33.13m bpd to ~32.33m bpd or ~2% of current production as of November 30.
Naturally, the supply side of the question being manipulated to support prices works best when demand remains the same or rises. Few are expecting that to be the case as evidenced by the inversion of the UST 2-5yield curve or the increasingly flattening UST 3m – 10yr yield curve, which measures the premium, albeit a shrinking premium of holding a 10yr UST against cash that now stands at ~49bps.
BRENT CONTANGO INDICATING OVERSUPPLY OUTPACING DEMAND

Naturally, you’re likely wondering how long the OPEC agreement to cut production will have a positive effect on the market. It’s hard to tell. If perceived demand continues to fall, which will depend largely on emerging markets led by China who of course, is in the midst of a trade war with the US.
The chart above shows the spread between the December 2019 WTI crude oil futures contract and the December 2020 WTI crude oil futures contract. A positive number brings about backwardation that aligns with a higher price (overlaid in orange) whereas a falling or negative number aligns with crude weakness.
After news broke of the OPEC+ deal to cut 1.2m bpd (800k by OPEC & 400k by non-OPEC members,) the spread shifted back to backwardation thought the sustainability of backwardation, which is inherently crude positive remains in doubt due to the declining growth outlook.
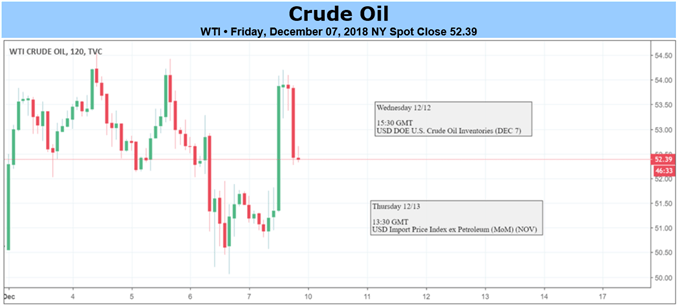
NEXT WEEK’S DATA POINTS THAT MAY AFFECT ENERGY MARKETS:
The fundamental focal points for the energy market next week:
- Saturday: China releases preliminary November trade data, including crude, fuels
- Monday: CFTC weekly commitments of traders report on various U.S.futures, options with data as of Tuesday Dec. 4 (delayed due to US day of mourning)
- Tuesday 12:00 ET: U.S. EIA’s Short-Term Energy Outlook
- Tuesday 16:30 ET: API issues weekly US oil inventory report
- Wednesday 06:00 et: OPEC monthly oil market report, including demand forecasts andOPEC November production est
- Wednesday 10:30 ET: EIA weekly U.S. oil inventory report
- Thursday 04:00 ET: IHS Intl Energy Executive Forum in Beijing, speakers include OPEC Secretary-General Mohammad Barkindo, BP China PresidentXiaoping Yang and ConocoPhillips Chief Economist Helen Currie
- Thursday 04:00 ET: IEA monthly oil market report, including demand forecasts andOPEC November production est.
- Friday 13:00 ET: Baker-Hughes Rig Count
- Friday 15:30 ET: Release of the CFTC weekly commitments of traders report on U.S. futures, options contracts
Disclosure: Do you want to see how retail traders are currently trading the US Dollar? Check out our IG Client Sentiment ...
more

