
OPEC Agrees To A 3 Month Cut Extension & A 6 Month Option
After the big meeting OPEC had, WTI oil closed up 10 cents at $57.40, making this out to seem like an unimportant event. However, that’s not the case because this decision was already priced in. It was so important that the market calculated exactly how it would affect prices before it occurred. The decision was to cut production for nine months, but it will be reviewed in June. The market feels it is a three month cut with an option for six more months. It seems like that six month option will be realized, but that will probably be the last of the cuts. The way this is structured gives us an answer to how the cuts will be ended. Because the market will be on edge in June, ending the cuts will be supported if the six month extension is agreed upon.

This is a great example of correctly managing the market’s expectations, getting the most bang for the buck in terms of oil price appreciation. That doesn’t solve the fracking problem, but there’s little OPEC+ Russia can do about that. The chart below shows how these quotas have affected oil prices compared to the previous production cuts. As you can see, these cuts have helped prices the third most, but it’s a big drop off from the top 2.
Dispersion Earlier In The Week
The chart below shows an interesting dispersion in sectors which occurred earlier this week. The semiconductor sector got hit hard as some say the cycle is over. Nvidia stock was down 9.47% in 3 days. Nvidia stock is up 129% in the past year so these drops are common and expected. Today the semiconductor index regained some of its losses as it was up 0.62%. On the other hand, the regional bank ETF hit an all-time high on Wednesday as it was up 6.82% when you combine Tuesday and Wednesday’s rally. Some of this is related to the tax cuts. Today, this index also reversed as it was down 0.85%. Reversals always occur when an index or stock moves sharply. However, most of both moves are still intact, making it worth talking about today.

Brazil Rate Cuts Improve Consumer Credit
In a previous article, I discussed how emerging markets’ central banks have been aggressively cutting interest rates in the past two years. That may be partially responsible for the cyclical upturn in those markets this year. The chart below shows the Brazilian central bank’s historical policy. As you can see, the 2017 rate cuts have created a new regime where consumer credit shows more signs of life. The curve has shifted up and to the left as rates are lower and consumer credit is higher. Brazil is just exiting a depression which means we shouldn’t be expecting a shift towards rate hikes anytime soon. I’m looking for Brazil to have a bounce back year in 2018.

Winners & Losers Of Tax Plan
The tax bill vote has been delayed because the tax hike trigger wasn’t deemed viable by the parliamentarian. We won’t know the effect of the plan until it is enacted, but the charts below give a potential outline of what will occur. Some of the numbers will change, but the framework should be similar. As you can see, the deficits will increase over time and the states with high tax rates like New York and California will be hurt. The high New York City taxes make that the worst area in the state.

As I mentioned in a previous article, the tech stocks are hurt by the tax cut because they pay such a low effective tax rate. As you can see from the chart below, the tech sector is the only one hurt by an effective tax rate of 23%. The most helped sector is telecom services. That makes for an interesting situation because telecom is the sector that does the worst at this point of the yield curve flattening cycle. Energy is one of the best sectors at this point in the yield curve cycle and is the sector that is the second most helped by tax reform. Financials also are winners in both categories. Obviously, there are more factors that you need to look at to decide what sector weighting you want besides just the yield curve and the tax rates, but it’s worth looking to see if you have any positions in tech stocks you want to take profits in, possibly putting that money into energy and financials.

Summary Of Valuations
In a previous article we showed the current streak where a 60% stock 40% bond portfolio hasn’t had a 10% correction in 8.7 years. With such a strong and long rally, it’s not surprising to see the table below showing that the median equity valuation is in the 88th percentile and the median debt valuation is in the 80th percentile. As you can see, with the ECB’s bond buying program, the bonds in Europe are in the 95th percentile and the stocks are in the 70th percentile.

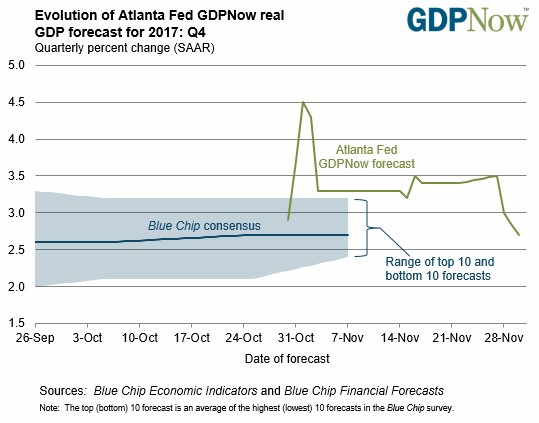
GDP Now Crashes
It’s very early in the quarter, so GDP estimates vary wildly. We saw evidence of this as the GDP Now forecast from the Atlanta Fed fell from 3.4% to 2.7% on Thursday. It fell because the estimate for net exports fell after the Advanced Economic Indicators Report and because the forecast for real consumer spending growth fell as a result of the personal income and outlays report. Now the Atlanta Fed is near the blue chip average.
Conclusion
The tax cut decision will weigh on the market, causing it to whipsaw in the next few days. A selloff could catalyze the Senate to act quicker as it won’t want to cause the first correction since President Trump was elected. With the latest rally, I think it’s very likely that the market will have its first 3% selloff of the year if it fails to pass.
Disclaimer: Neither TheoTrade or any of its officers, directors, employees, other personnel, representatives, agents or independent contractors is, in such capacities, a licensed financial adviser, ...
more

