
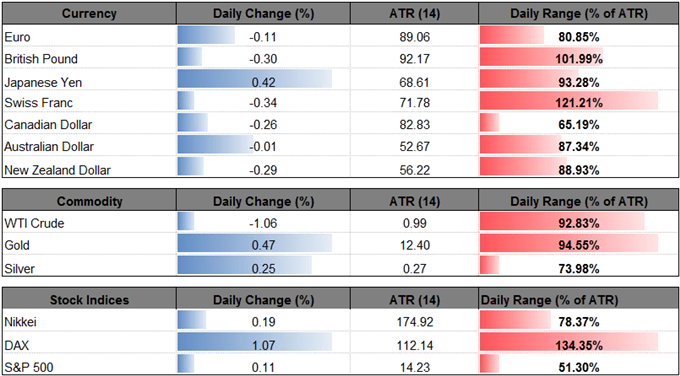
Oil Prices Risk Further Losses As RSI Slips From Overbought Territory
FX Talking Points:
- USD/JPY Rebound Unravels Ahead of BoJ; U.S. GDP Report on Tap.
- Crude Oil Prices to Face Larger Pullback as RSI Falls Back From Overbought Territory.

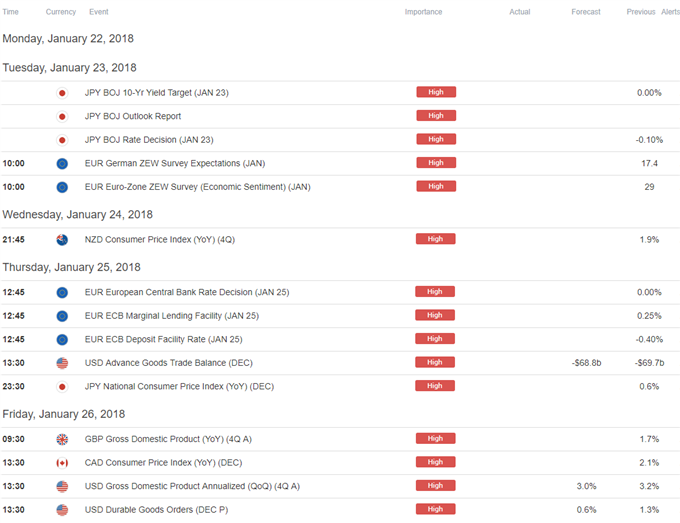
USD/JPY remains under pressure as the U. of Michigan Confidence survey unexpectedly narrows to 94.4 from 95.9 in December, with the pair at risk for further losses as it imitates a fresh series of lower highs and lows ahead of the Bank of Japan’s (BoJ) first interest rate decision for 2018.
The BoJ meeting may do little to alter the near-term outlook for the dollar-yen exchange rate as the central bank continues to embark on its Quantitative/Qualitative Easing (QQE) Program with Yield-Curve Control, and Governor Haruhiko Kuroda and Co. may merely attempt to buy more time as inflation runs below the 2% target. In turn, market participants are likely to pay increased attention to the fresh developments coming out of the U.S. economy especially as the advanced Gross Domestic Product (GDP) report is anticipated to show the growth rate slowing to an annualized 3.0% from 3.2% in the third-quarter of 2017.
Another batch of mixed data prints may spark a bearish reaction in the dollar as it dampens bets for an imminent Fed rate-hike, and the Federal Open Market Committee (FOMC) may also endorse a wait-and-see approach at the January 31 rate decision as ‘some participants observed that there was a possibility that inflation might stay below the objective for longer than they currently expected.’ As a result, the near-term rebound in USD/JPY may continue to unravel, with the downside targets coming back on the radar as the pair struggles to climb back above the 111.10 (61.8% expansion) to 111.60 (38.2% retracement) region.
USD/JPY Daily Chart
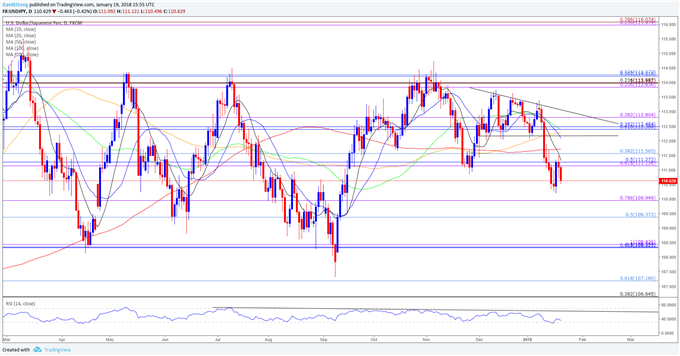
- USD/JPY stands at risk of extending the decline from earlier this year as it breaks the descending triangle carried over from late-2017, with the broader outlook tilted to the downside as the Relative Strength Index (RSI) preserves the bearish formation from the summer months.
- Need a break/close below the 109.40 (50% retracement) to 110.00 (78.6% expansion) region to open up the next area of interest around 108.30 (61.8% retracement) to 108.40 (100% expansion), which sits just above the 2017-low (107.32).
- Keeping a close eye on the RSI as it appears to be working its way back towards oversold territory, with a break below 30 raising the risk for a further decline in the dollar-yen exchange rate as the bearish momentum gathers pace.

Crude continues to fall back from the 2018-high (64.86), with oil prices at risk of facing a further losses as the International Energy Agency (EIA) warns ‘explosive growth in the U.S. and substantial gains in Canada and Brazil will far outweigh potentially steep declines in Venezuela and Mexico.’
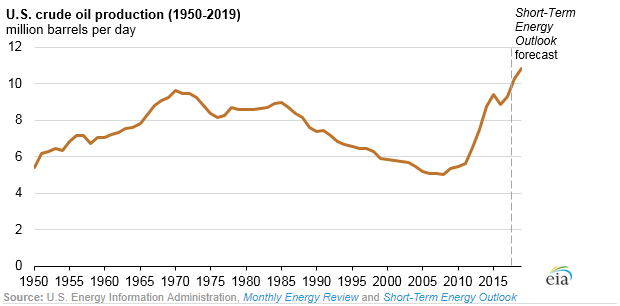
At the same time, the U.S. Energy Information Administration (EIA) forecasts ‘total U.S. crude oil production to average 10.3 million barrels per day (b/d) in 2018, up 10% from 2017,’ and projections for higher output may keep energy prices under pressure as production is expected to exceed the previous record of 9.6 million b/d set in 1970.
The ongoing expansion in U.S. supply may push the Organization of the Petroleum Exporting Countries (OPEC) to enlist additional measures to rebalance the energy market, but crude prices stand at risk of exhibiting a more bearish behavior over the near-term especially as the Relative Strength Index (RSI) slips below 70 and flashes a textbook sell-signal.
USOIL Daily Chart
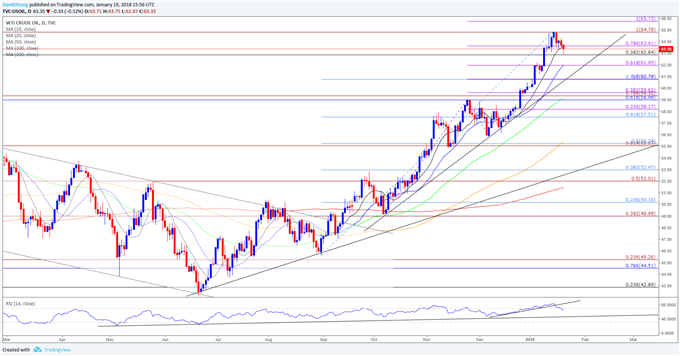
- Keep in mind, broader outlook for crude remains constructive as both price and the Relative Strength Index (RSI) extend the bullish formations carried over from 2017.
- However, the near-term outlook for USOIL remains capped by the 64.80 (100% expansion) region, with a close below 62.80 (38.2% retracement) opening up the 62.00 (61.8% expansion) handle, which largely lines up with trendline support.
- Next downside region of interest comes in around 60.80 (78.6% retracement) followed by the former-resistance zone around 59.00 (61.8% retracement) to 59.60 (38.2% expansion).
Disclosure:Interested in trading? Review the ‘
Traits of a Successful Trader’ series on how to ...
more

