Monday, December 4, 2017 2:48 PM EDT
NZD/JPY Daily Chart
(Click on image to enlarge)
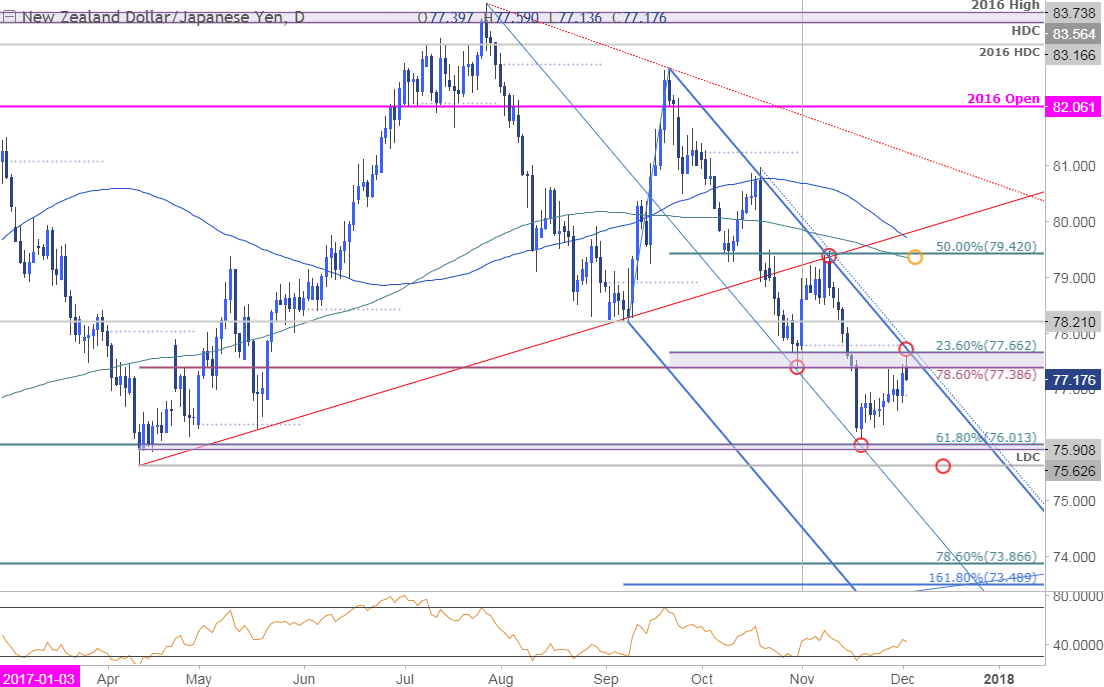
Technical Outlook: NZD/JPY has been trading within the confines a well-defined descending pitchfork formation extending off the yearly highs with prices trading into the 77.38/66 resistance zone today before turning lower. Notice the similarities in the previous failure patterns into this upper parallel – heading into the open in December, we’re looking for an exhaustion high while below this slope. Key support remains at 75.91-76.01 with a break below 75.63 needed to expose the next leg lower targeting 73.86 & 73.50.
NZD/JPY 240min Chart
(Click on image to enlarge)
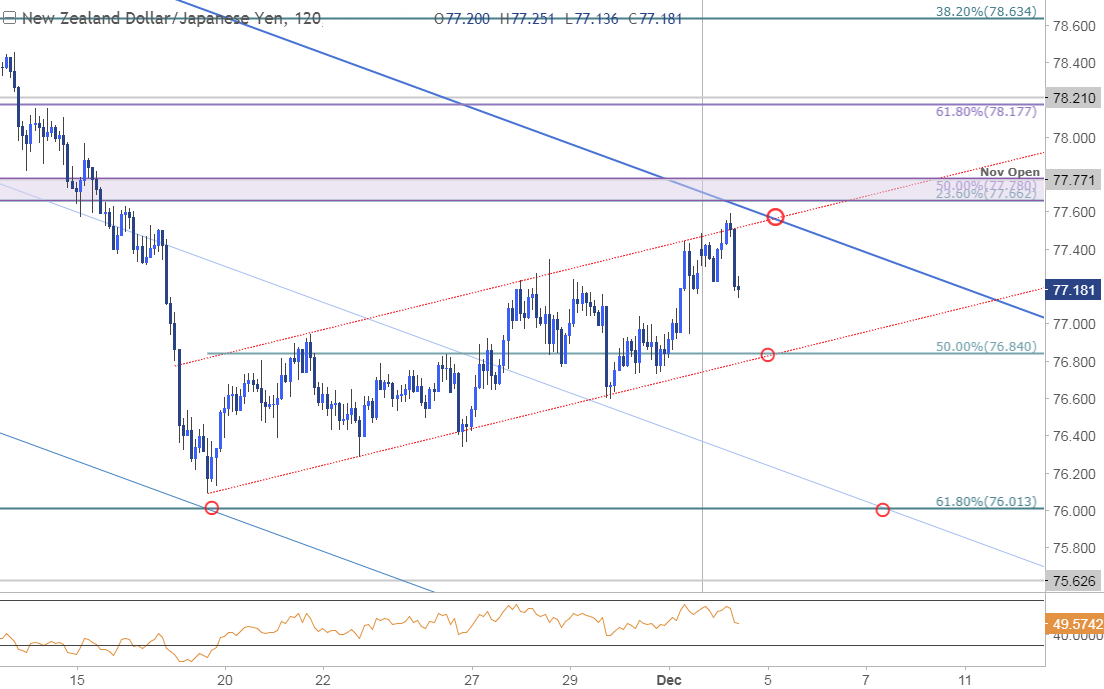
Notes: A closer look at price action highlights a near-term ascending channel formation extending off the November lows with channel resistance converging on the upper parallel (blue) over the next few days. Note that ongoing momentum divergence leaves the advance vulnerable here and while we cannot rule out another run at the highs, our focus is lower while below this threshold with a break below 76.84 shifting the focus back towards the 50-line / 61.8% retracement at 76.01.
Bottom line: looking for an exhaustion high early in the month while below 77.66/77 with a downside break of this near-term channel needed to kick things off. Note that it’s still early in the month and we’ll be looking for the December opening range to offer further clarity on our medium-term directional bias. A topside breach would invalidation our near-term outlook with such a scenario risking a rally back towards 78.18/21 and 78.63.
Disclosure: DailyFX, the free news and research website of leading forex and CFD broker FXCM, delivers up-to-date analysis of the ...
more
Disclosure: DailyFX, the free news and research website of leading forex and CFD broker FXCM, delivers up-to-date analysis of the fundamental and technical influences driving the currency and commodity markets. With nine internationally-based analysts publishing over 30 articles and producing 5 video news updates daily, DailyFX offers in-depth coverage of price action, predictions of likely market moves, and exhaustive interpretations of salient economic and political developments. DailyFX is also home to one of the most powerful economic calendars available on the web, complete with advanced sorting capabilities, detailed descriptions of upcoming events on the economic docket, and projections of how economic report data will impact the markets. Combined with the free charts and live rate updates featured on DailyFX, the DailyFX economic calendar is an invaluable resource for traders who heavily rely on the news for their trading strategies. Additionally, DailyFX serves as a portal to one the most vibrant online discussion forums in the forex trading community. Avoiding market noise and the irrelevant personal commentary that plague many forex blogs and forums, the DailyFX Forum has established a reputation as being a place where real traders go to talk about serious trading.
Any opinions, news, research, analyses, prices, or other information contained on dailyfx.com are provided as general market commentary, and does not constitute investment advice. Dailyfx will not accept liability for any loss or damage, including without limitation to, any loss of profit, which may arise directly or indirectly from use of or reliance on such information.
** All times listed in GMT. See the full DailyFX economic calendar here.
less
How did you like this article? Let us know so we can better customize your reading experience.


