
Labor Strikes In China
The China Labour Bulletin website provides maps displaying incidents of labour strikes that have occurred in recent years. While of course these should be viewed with a hefty grain of salt, they may be worth scrutinizing all the same.
This image below shows the number of strikes in general that have occurred since 2011; as you can see, they have been becoming a lot more common since the beginning of 2014.
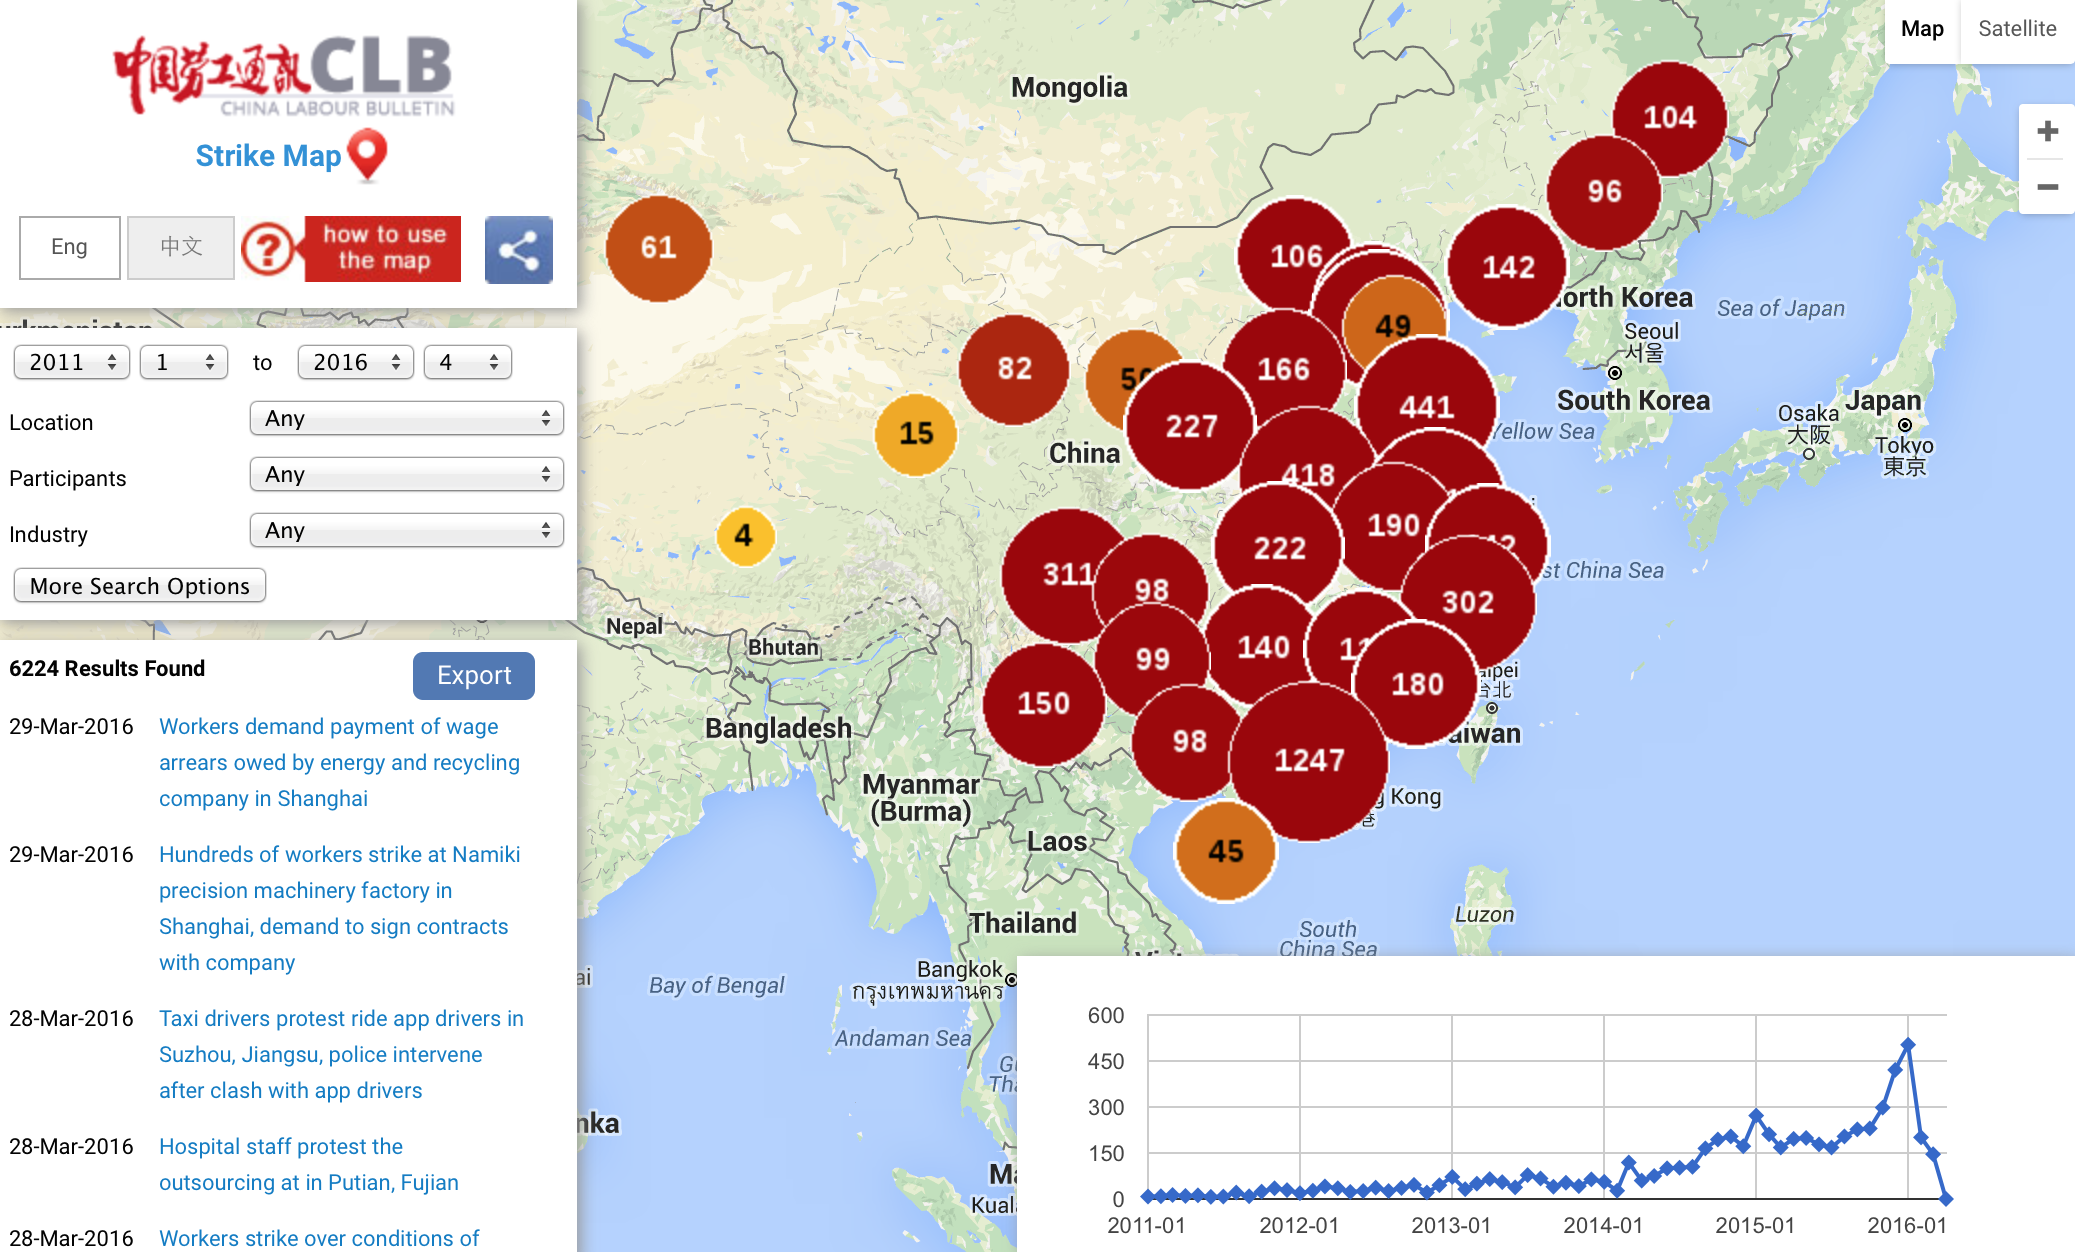
Yet this may be somewhat misleading: nearly half of the strikes indicated in the map above are thought to have had fewer than 100 people participate in them. It may be better to look just at the number of larger strikes that have occurred, as the following two maps do:
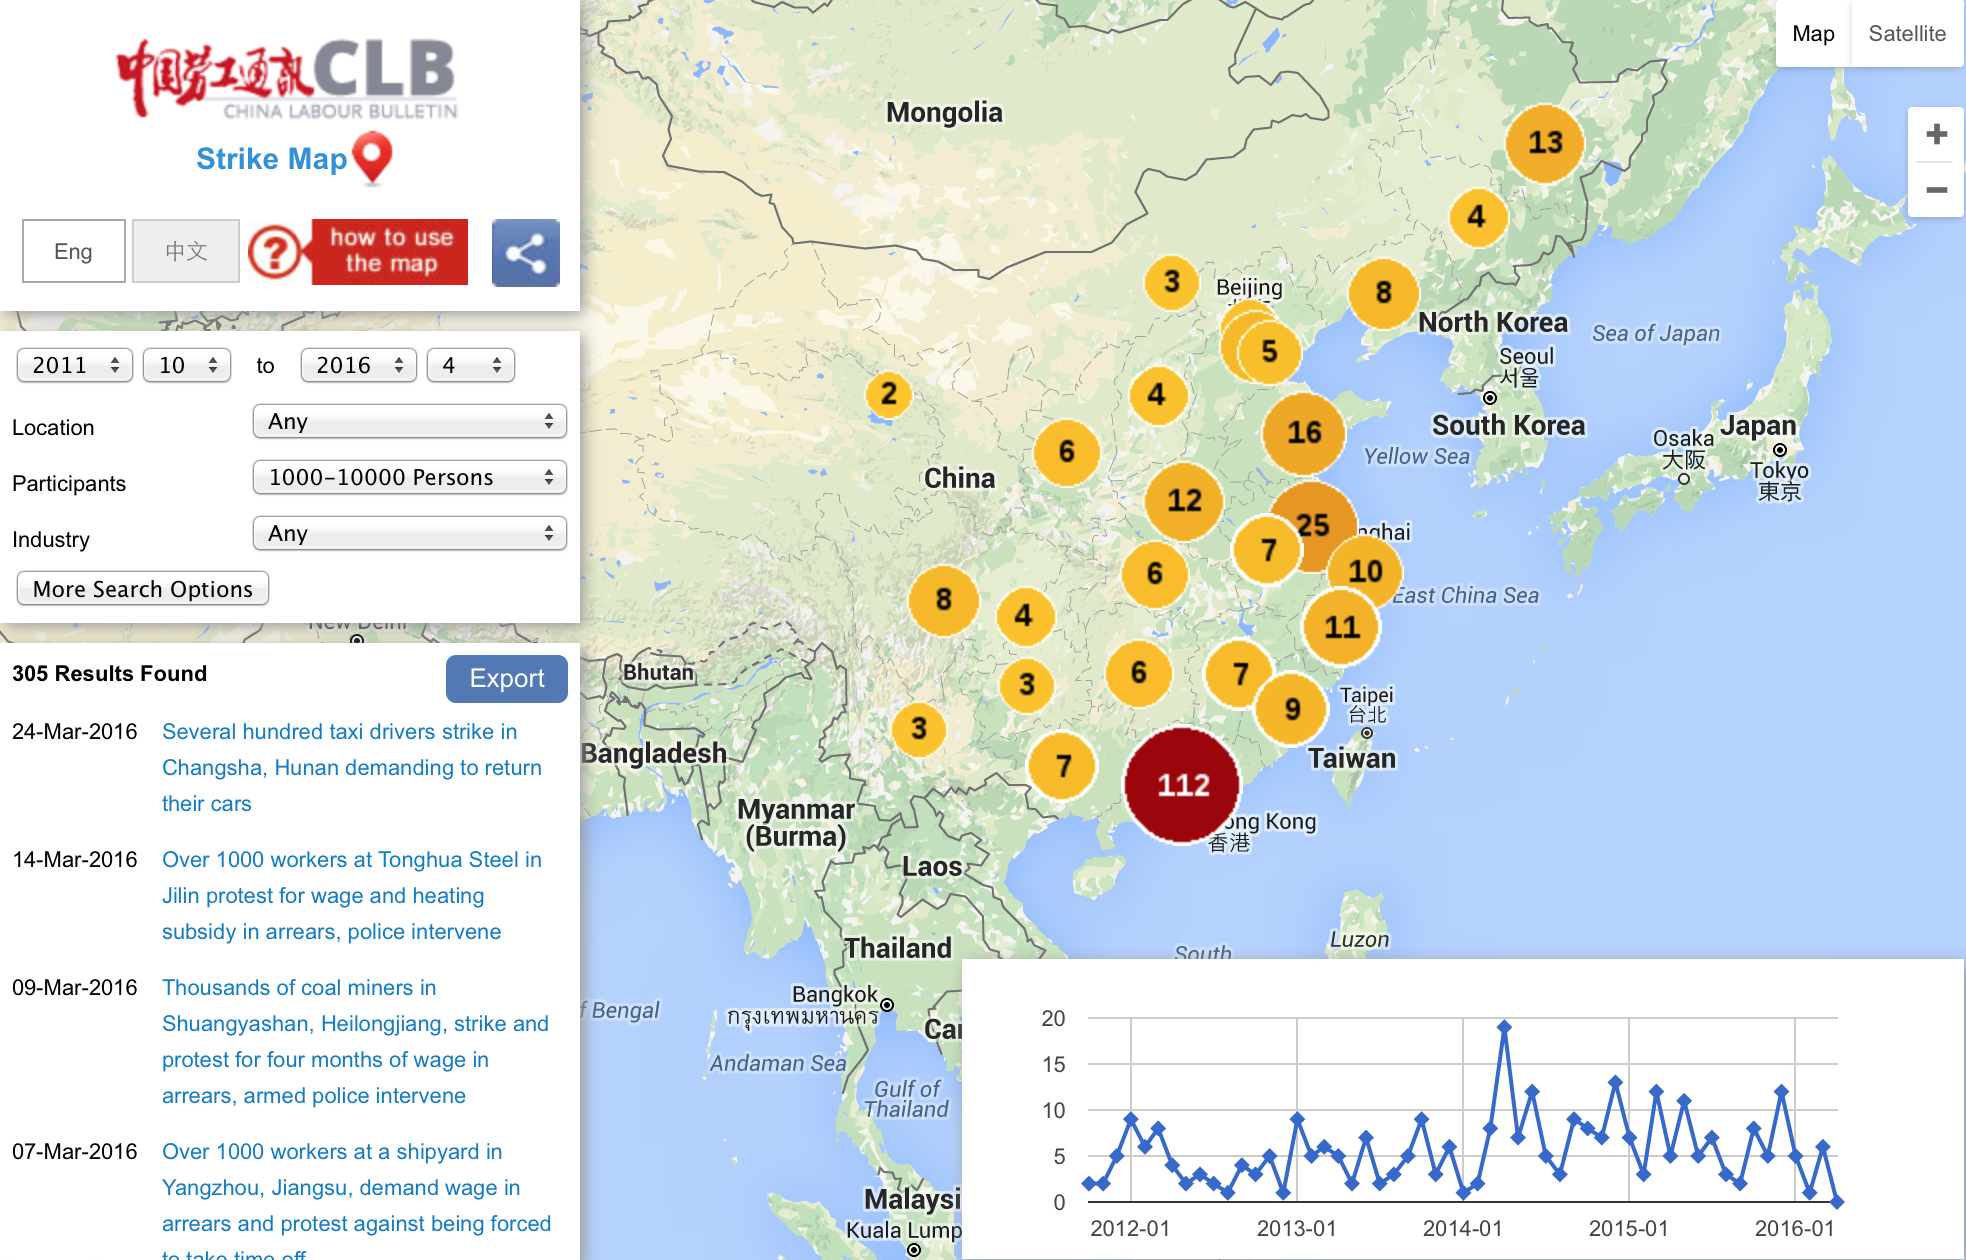

These maps above show that the larger strikes, with 1000-10,000 people and 10,000+ people, respectively, occurred most often in 2014, unlike the smaller but more numerous strikes that occurred most frequently in 2015 and so far in 2016. Since 2015 there have not been any strikes involving more than 10,000 people, in fact, according to the China Labour Bulletin.

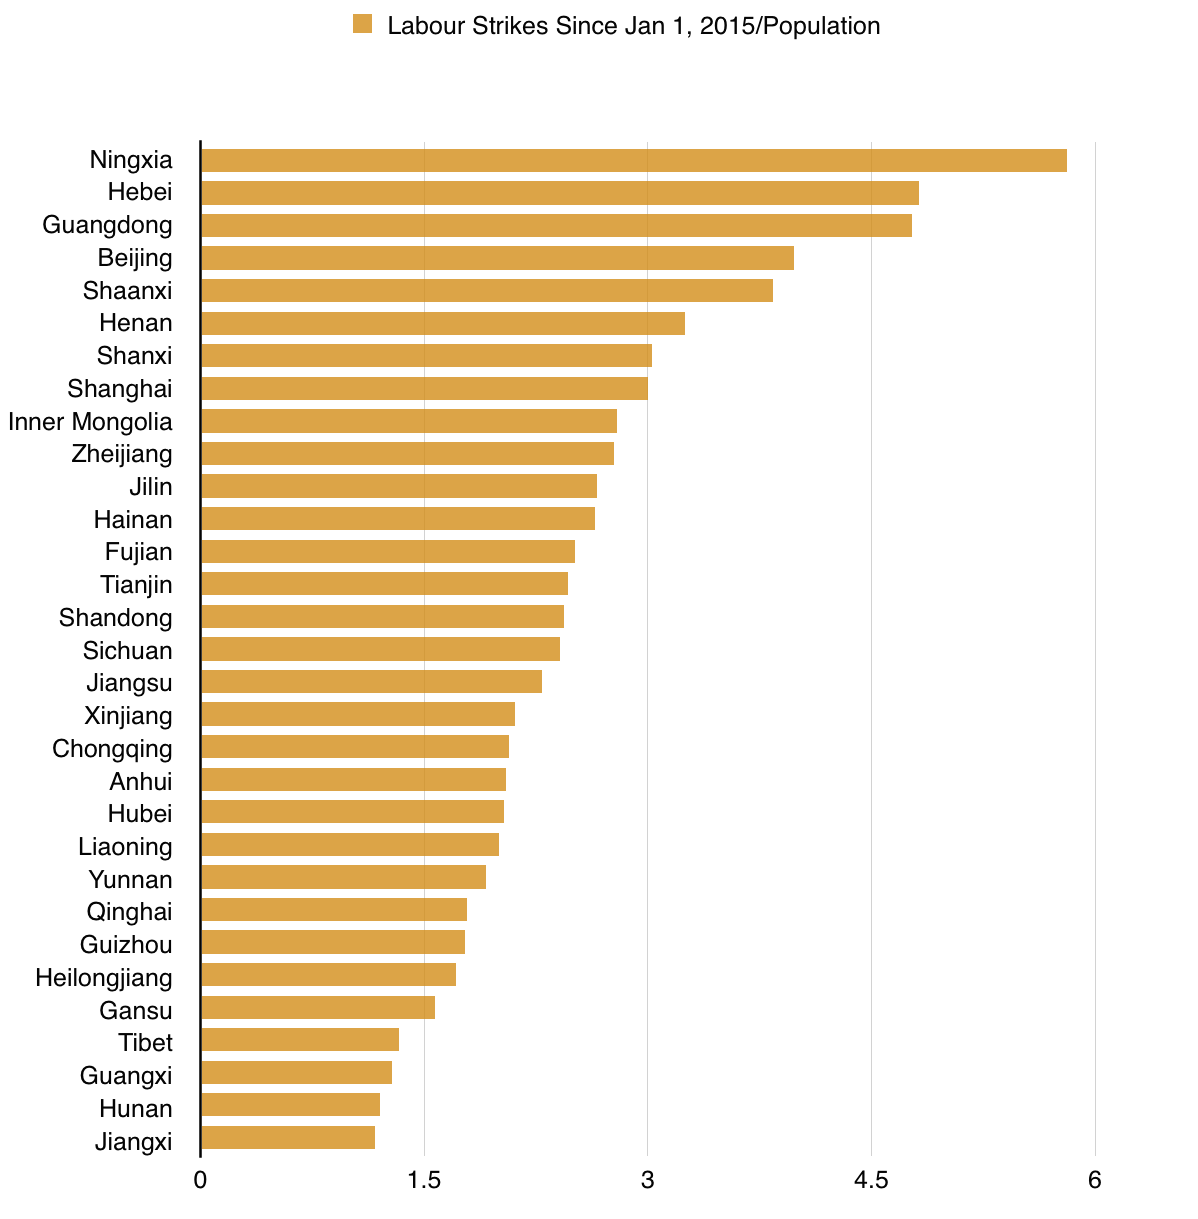
Now let’s have a closer look at the differences between China’s many provinces. Below I have tried to graph out the number of strikes that have occurred in each province, first since 2011 and then since 2015:
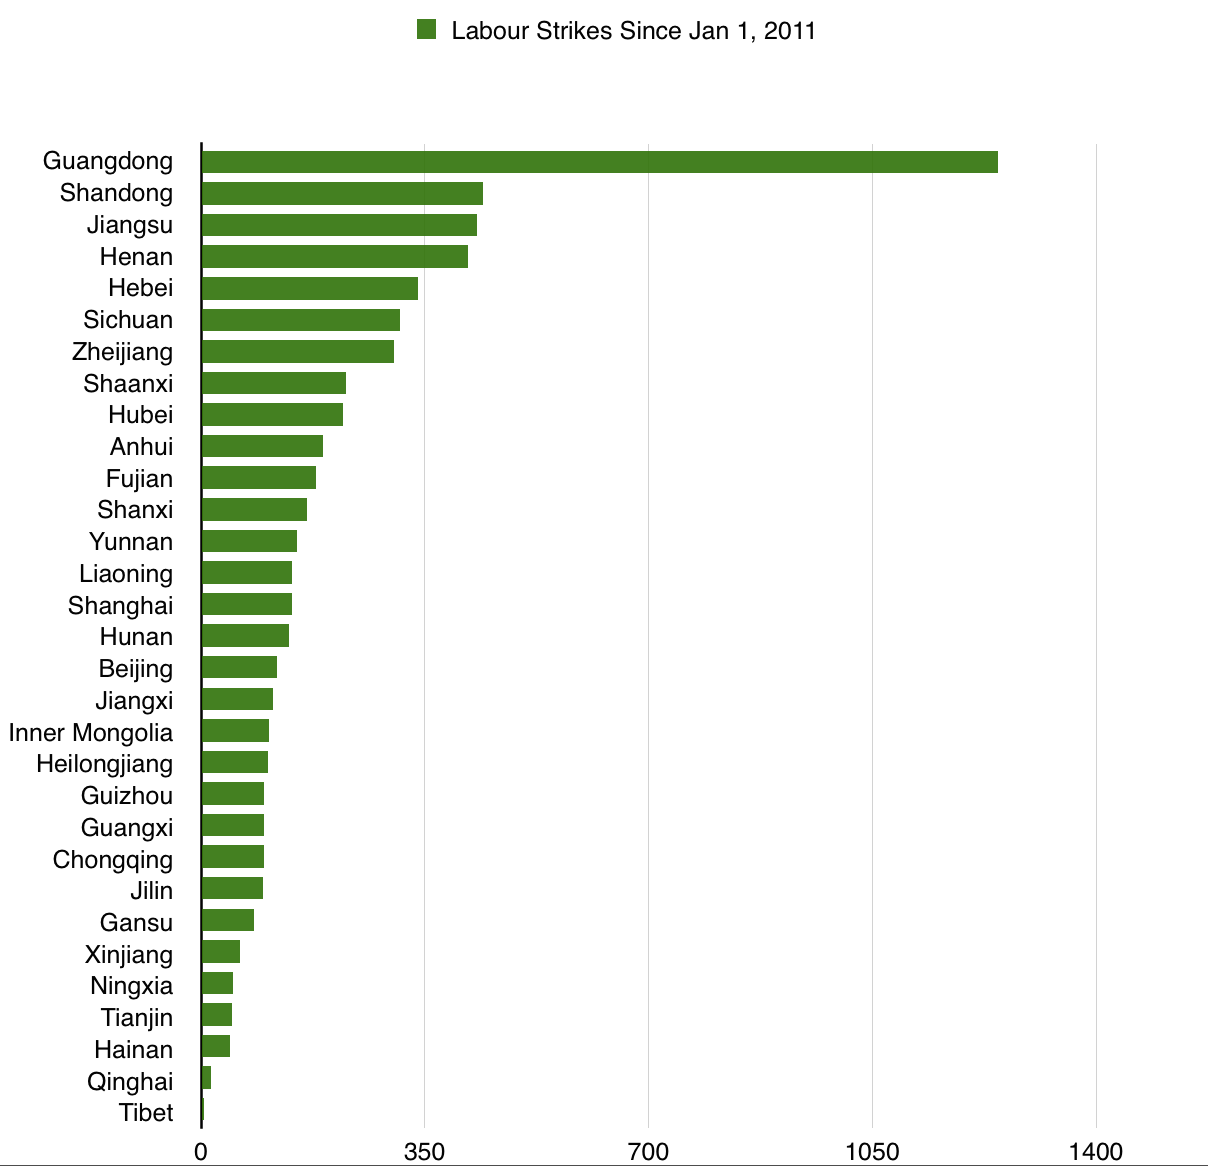
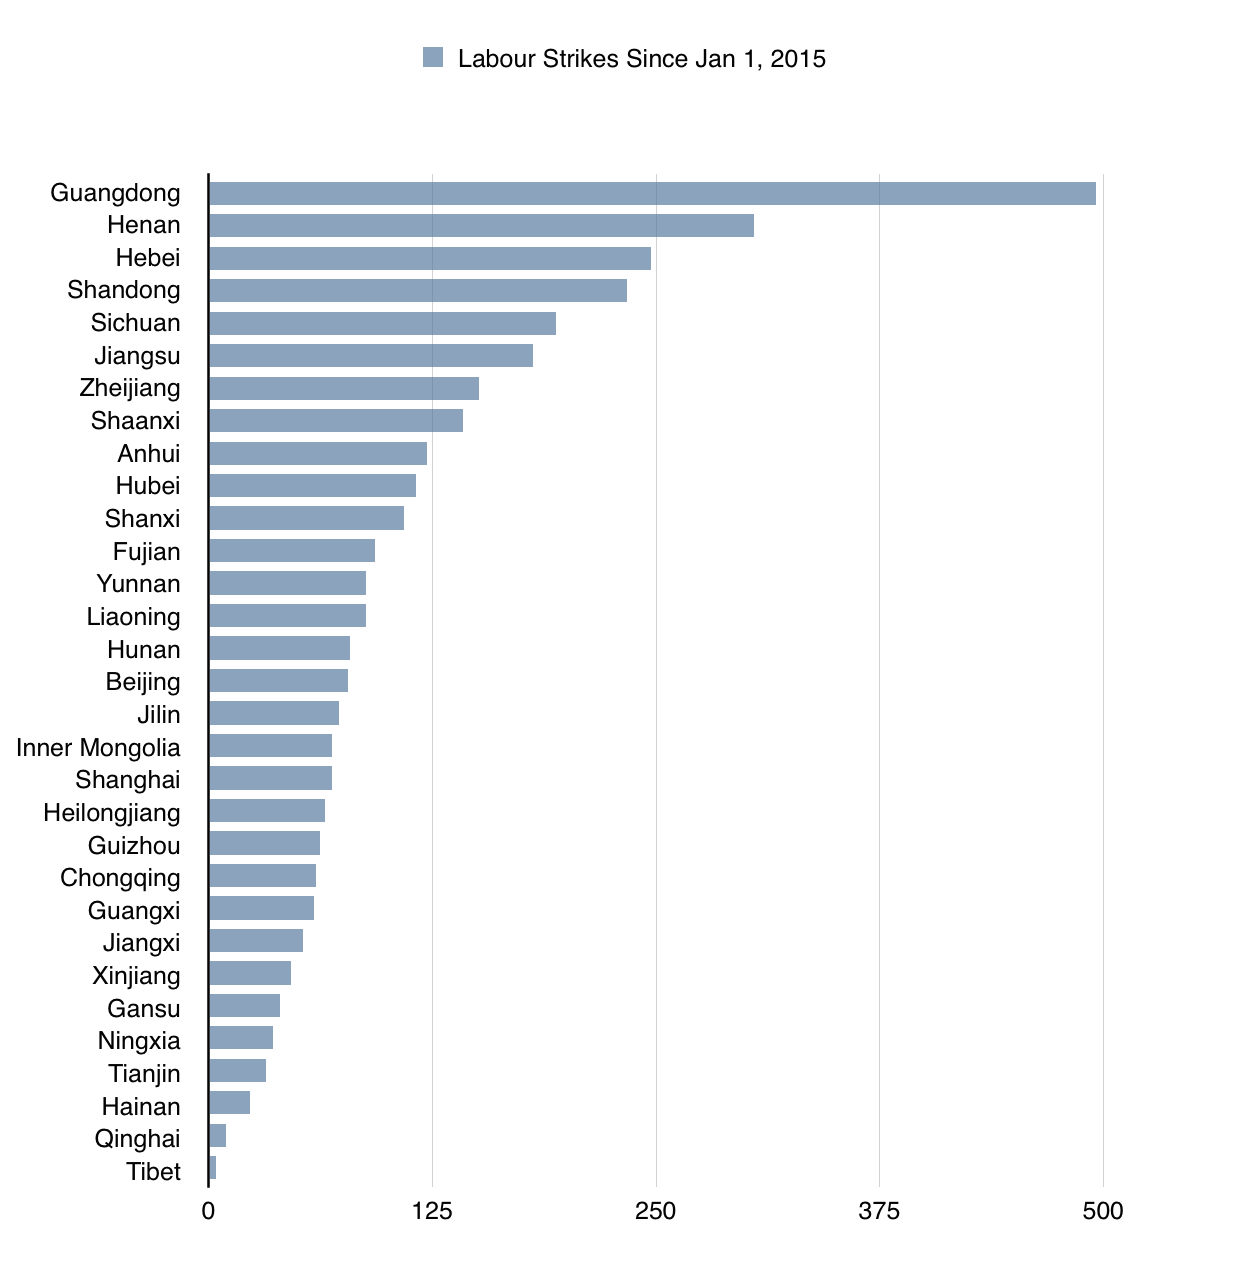
Guangdong, China’s most populous province, finished at the top of both graphs, while Tibet, Qinghai, Hainan, Tianjin, Ningxia, Gansu, and Xinjiang finished at the bottom of both graphs. All of the provinces of China are more or less in the same position in both graphs, in fact. And there are no major regional patterns that can be gleaned clearly from either list.
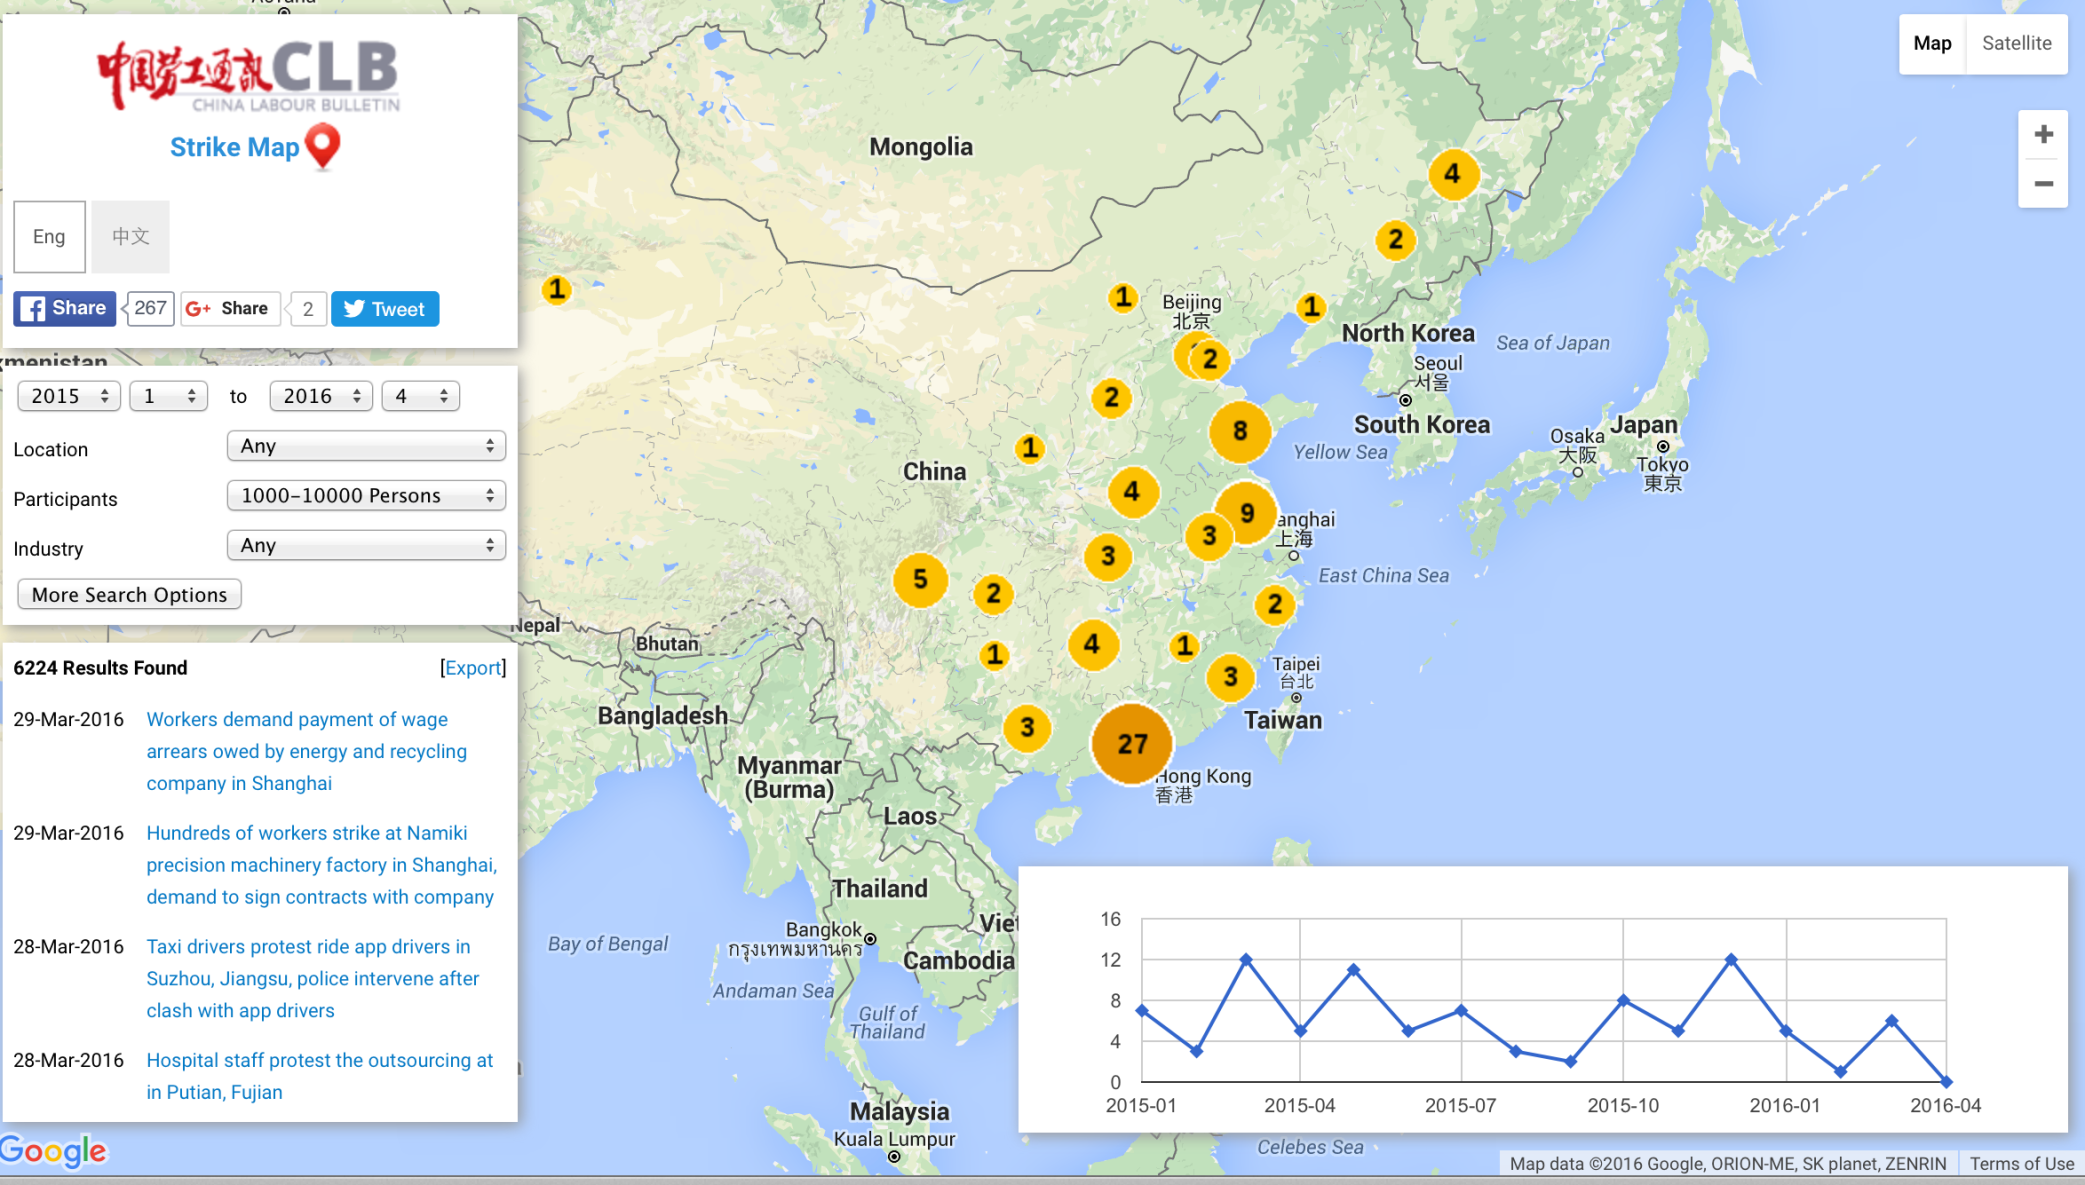
Labour strikes since January 1, 2015 involving at least one thousand people. Guangdong had 27, followed by Jiangsu with 9 and Shandong with 8.
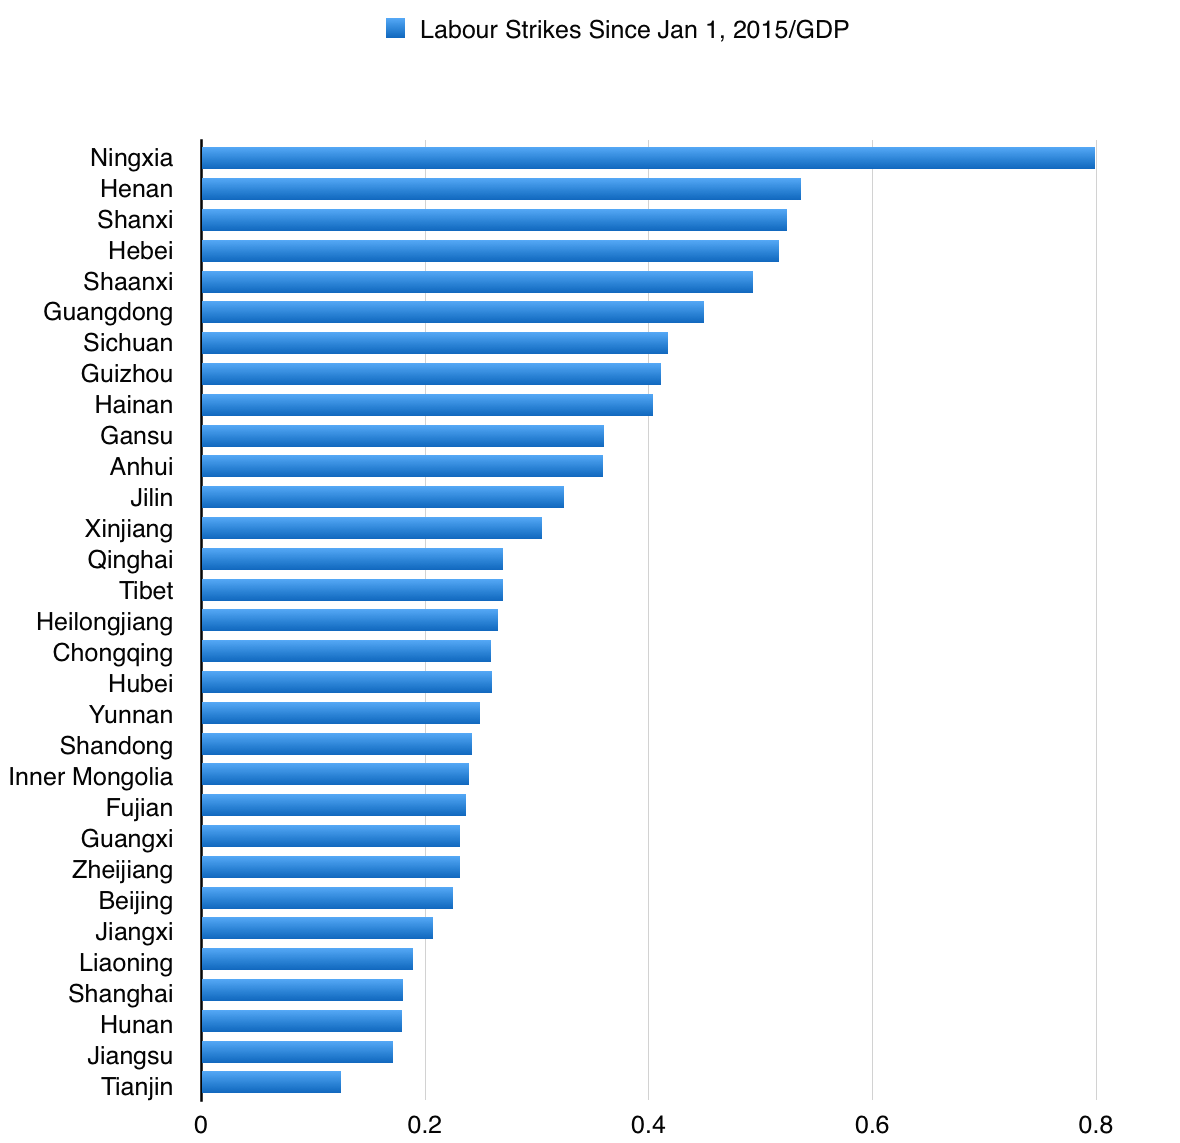
What if we adjust the figures to take into account the population size and GDP size of each province? Then we get the following graphs:
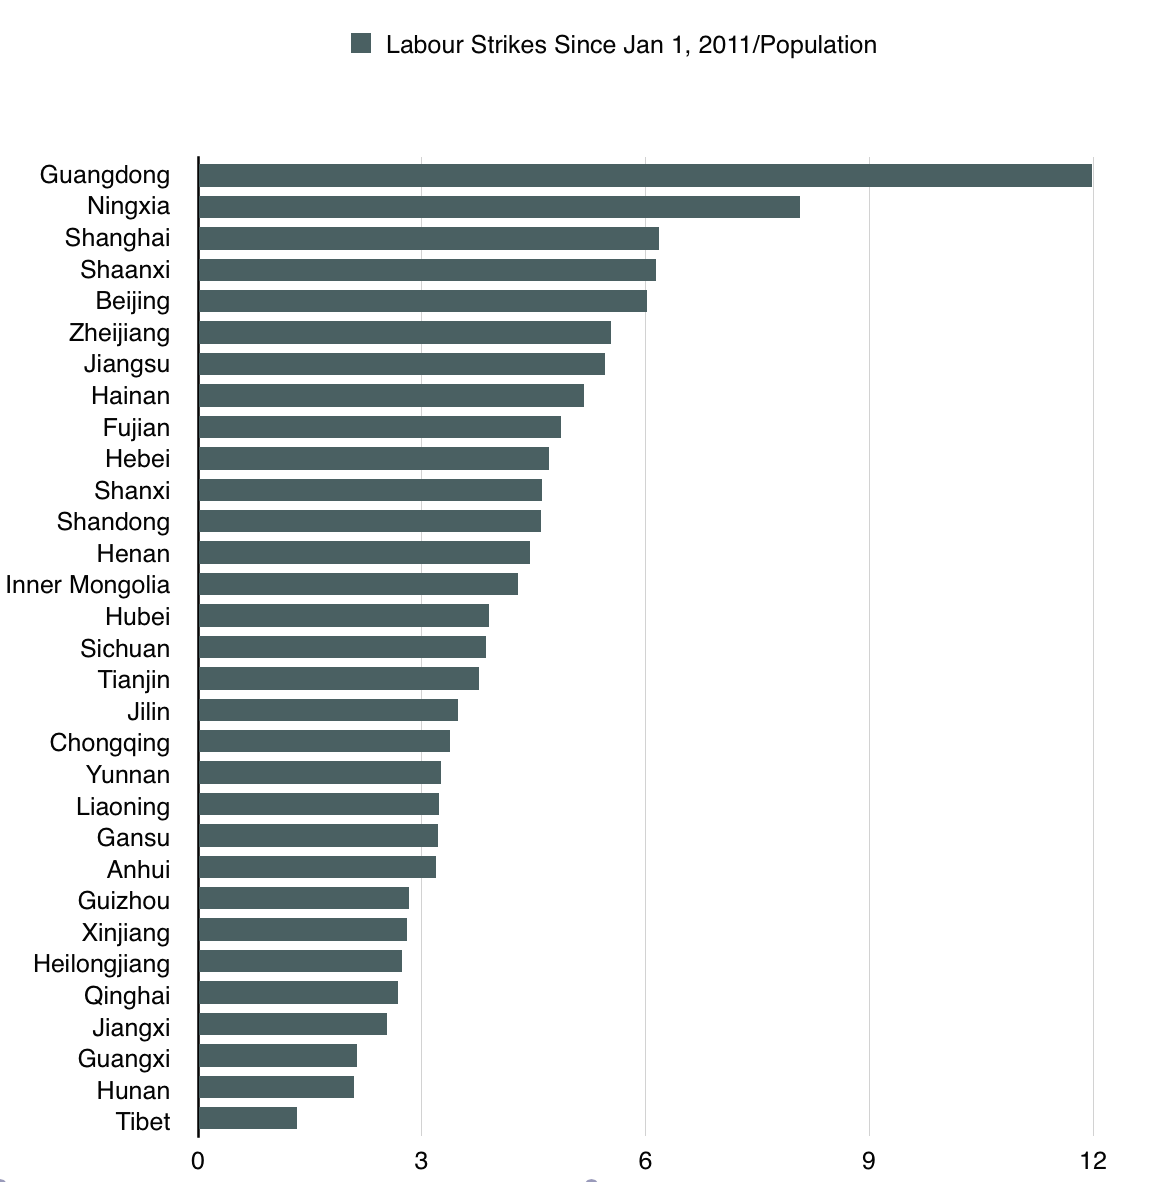

Here Guangdong and Tibet again finished at the top and bottom of both graphs, respectively, but Ningxia, which had finished fifth from the bottom before adjusting for population and GDP, has now moved up to second from the top. Ningxia is China’s third least populous province (the two Tibetan provinces, Tibet and Qinghai, are the least populous), is one of China’s five “autonomous regions” (the others being Tibet, Xinjiang, Inner Mongolia, and Guangxi), and, apart from Xinjiang, has by far the highest concentration of (Hui, not Turkic Uyghur) Muslim inhabitants of any province in the country.
In the adjusted-for-population graph, China’s small (by Chinese standards), wealthy “direct-controlled municipalities”, namely Shanghai, Beijing, Tianjin, and Chongqing all were much higher up than they were on the adjusted-for-GDP graph, with the exception of Chongqing (which is quite a bit less urbanized than the three others are). Shanghai and Beijing were third and fifth, respectively, while Tianjin, which was at the very bottom of the adjusted-for-GDP graph, was close to the middle of the pack in the adjusted-for-population one.
Another big change was Hainan, China’s southernmost province and only island province (not counting Hong Kong, Macau, or Taiwan), which was third from the bottom before adjusting for population size or GDP, but fourth from the top when adjusting for GDP and eighth when adjusting for population size. Shanxi and Shaanxi, meanwhile, two neighbouring provinces located in and around the mountains of north-central China, moved from around the middle of the pack to near the top once adjusted for GDP and population.
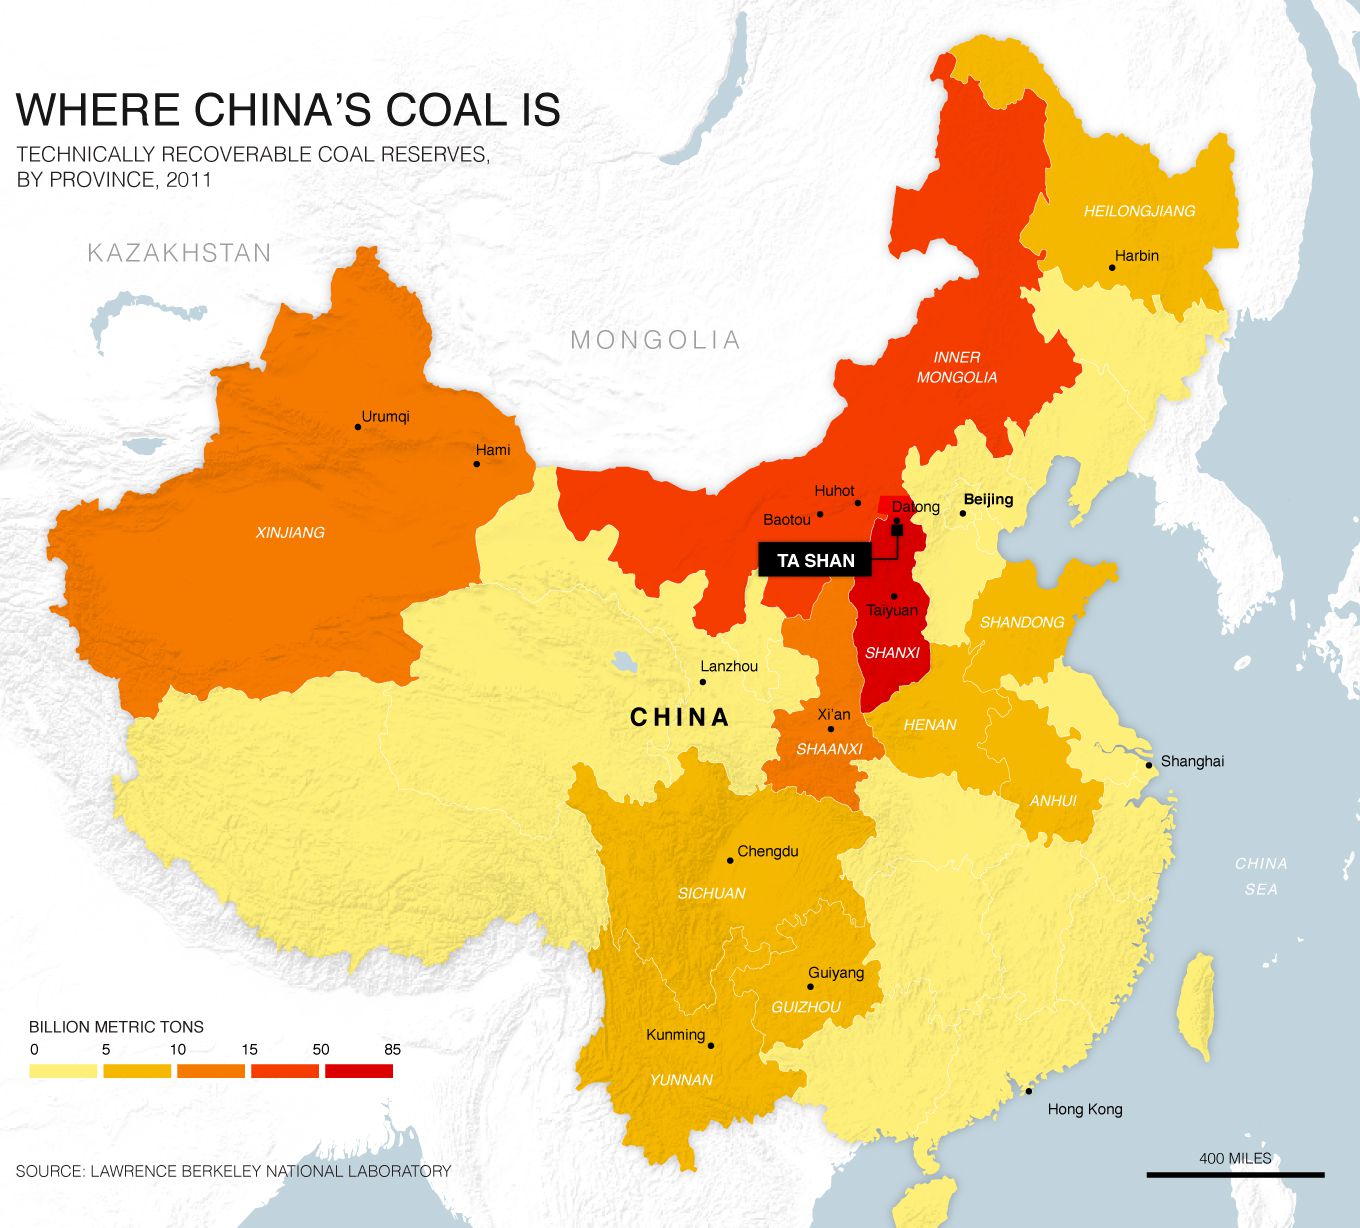
Shanxi in particular is China’s (and, along with Wyoming, the world’s) major coal producing region, and the coal industry has come under a lot of pressure in recent years, which may help explain Shanxi’s high position on both of these graphs. (Shaanxi too is a top coal producer; Inner Mongolia, though, China’s second biggest coal producer, is admittedly near the bottom of the GDP-adjusted labour strikes graph). Shanxi has also been arguably the main provincial target by far of Xi Jinping’s intense “anti-corruption” campaign.
Still, these graphs again do not prioritize large strikes over smaller ones. Below, then, are the strikes with between 1000 – 10,000 participants that have occured since 2011. Since there have been very few strikes with more than 10,000 participants, the 1000-10,000 category accounts for an overwhelming share of the large labour strikes that have taken place:
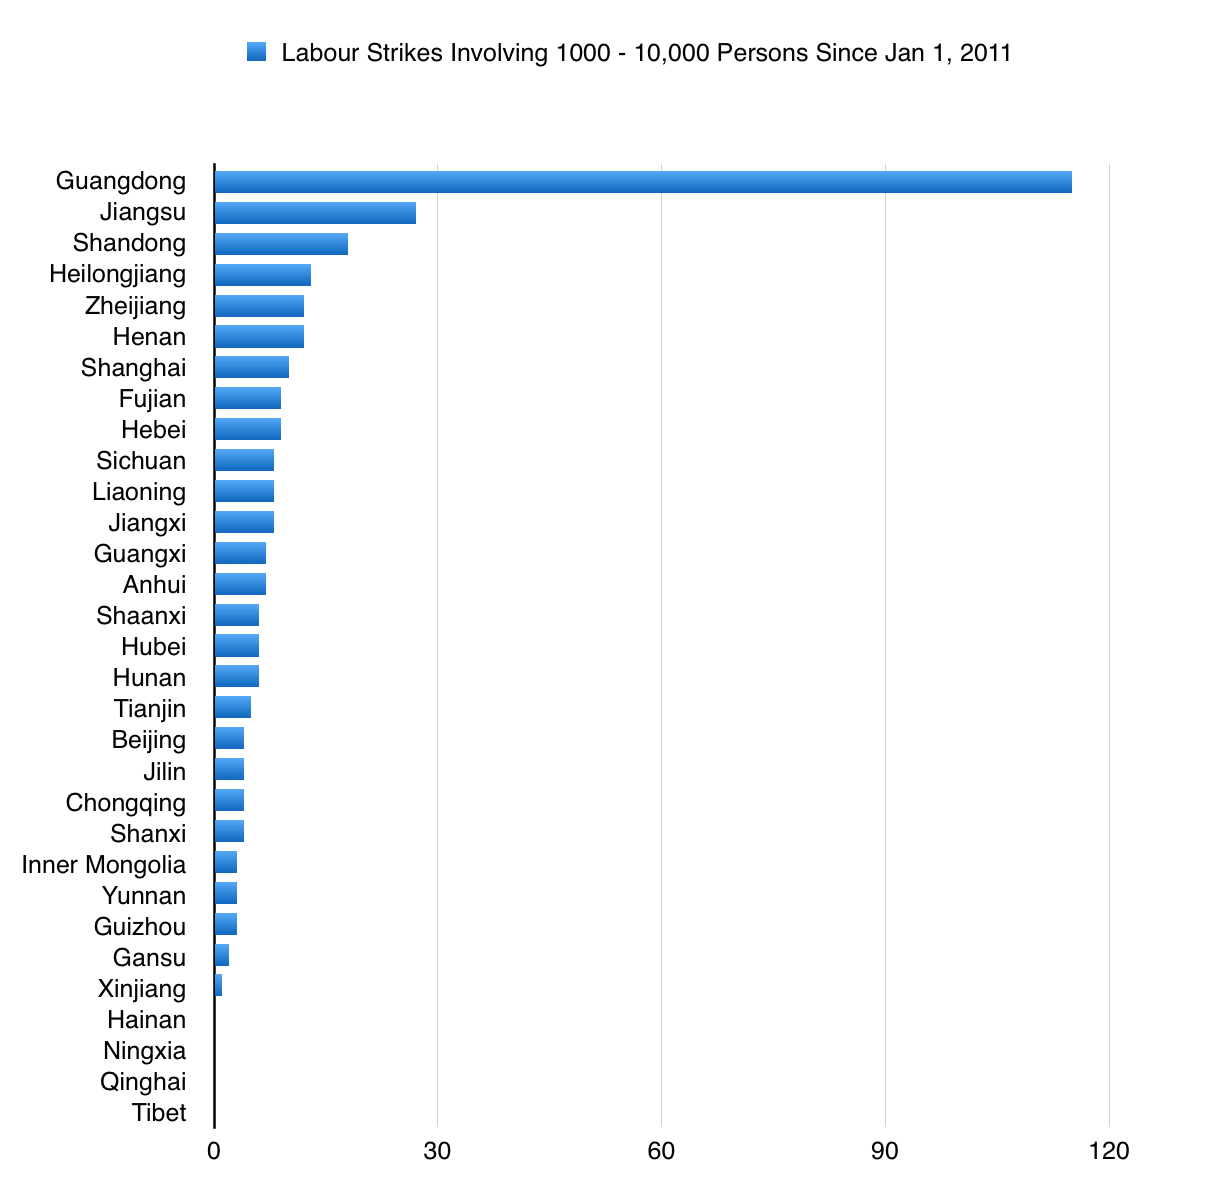
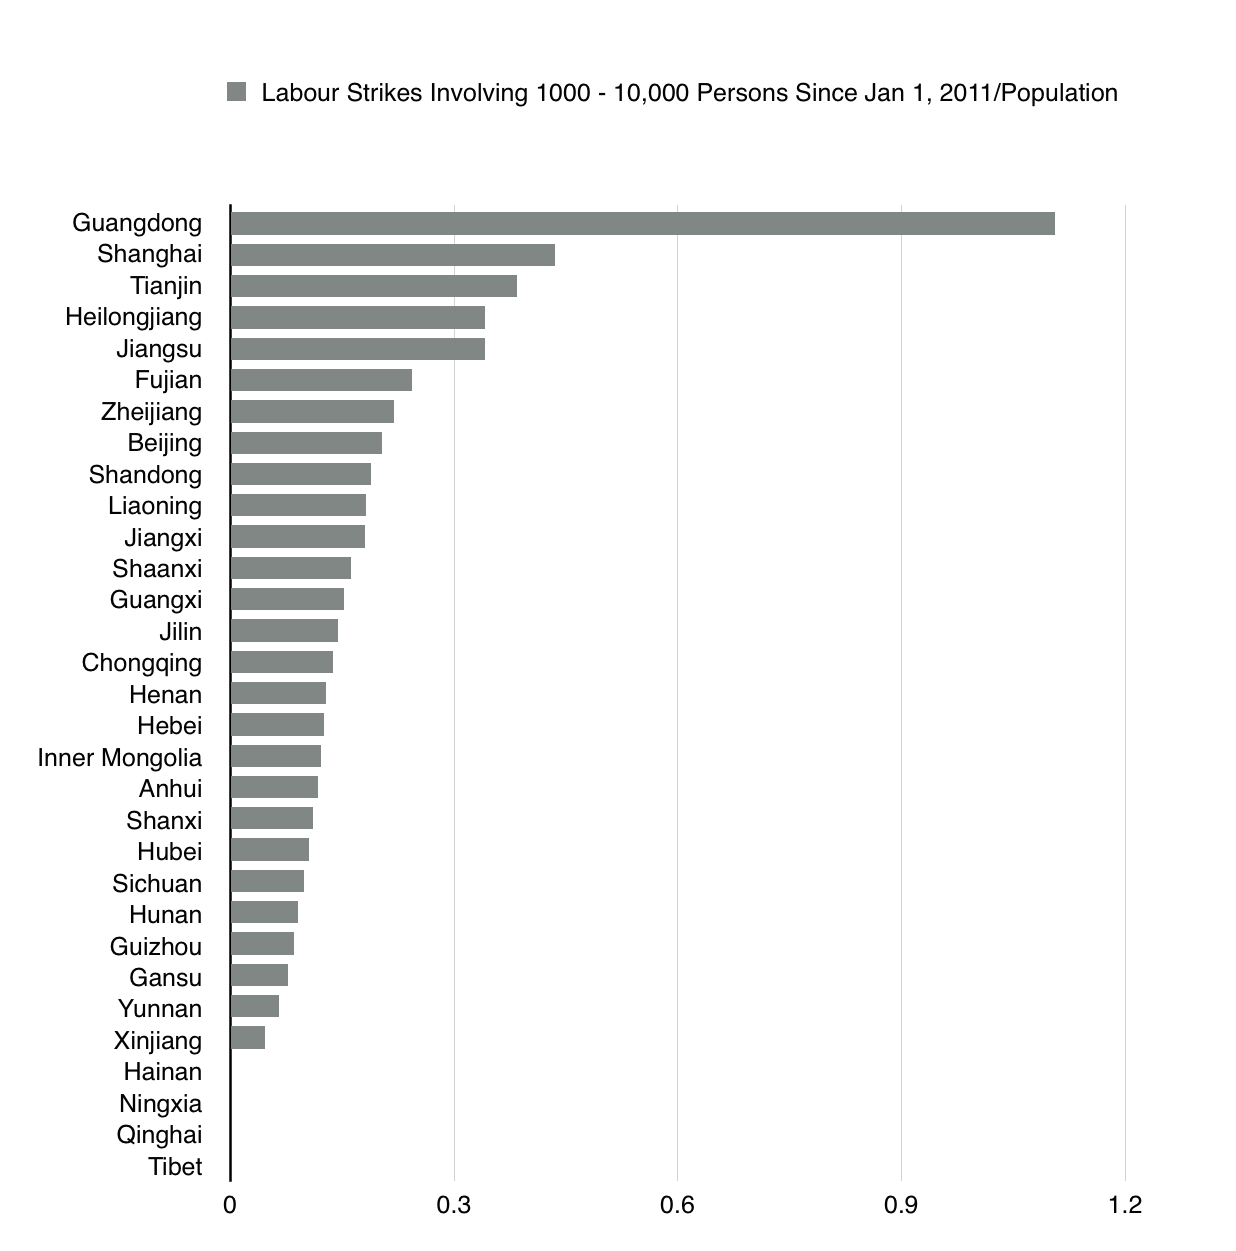
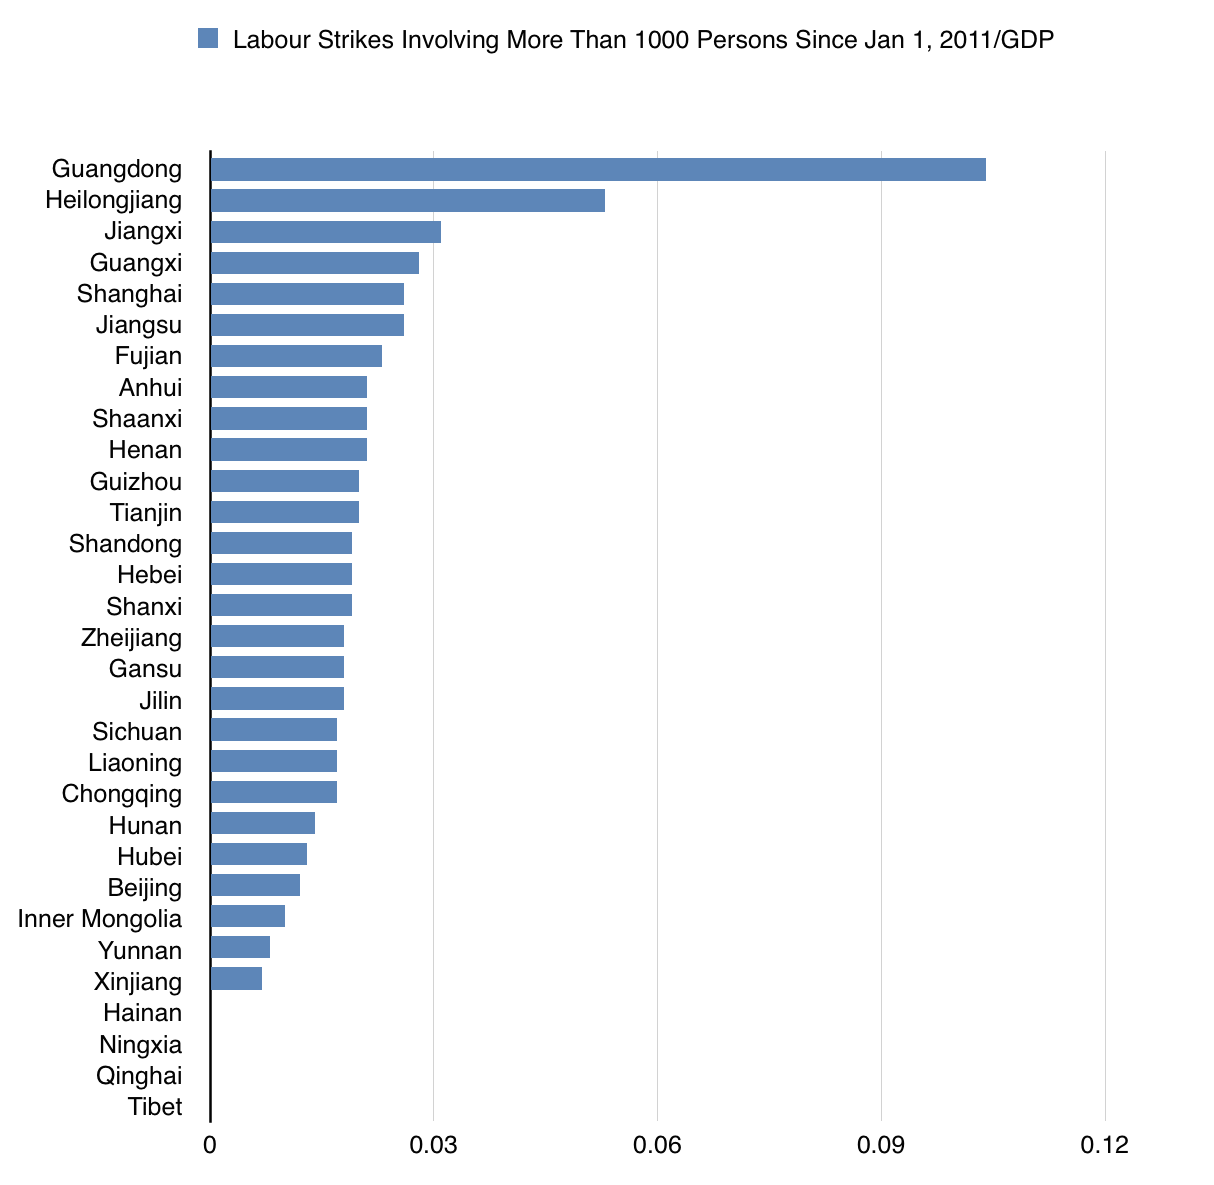
The graph showing labour strikes with 1000-10,000 people since 2011, adjusted for GDP size, is, I suspect, the most important one. The population-adjusted graphs tend to somewhat misleadingly overemphasize the wealthiest provinces, like Shanghai, Tianjin or Guangdong, since they have lots of per capita economic activity and therefore also lots of per capita labour strikes. The non-adjusted graphs skew in favour of populous provinces, meanwhile. The GDP-adjusted graphs, though, are perhaps more indicative of provinces in which there may be growing social challenges to China’s political and/or economic establishment.
Notably, this GDP-adjusted graph is also the only one in which clear regional divisions can be seen. Western provinces like Tibet, Qinghai, Xinjiang, Yunnan, Ningxia, and Gansu are at the bottom. The south-central/south-western region of Hunan, Hubei, Chongqing, and Sichuan is also near the bottom. Beijing and the provinces around Beijing, like Liaoning, Inner Mongolia, Hebei, Henan, Tianjin, Shanxi, and Shandong are near the bottom or the middle. Guangdong, the heartland of Cantonese (rather than Mandarin) and the only province in China to border Hong Kong and Macau, remains far ahead at the top of the list, while three of Guangdong’s four neighbouring provinces, namely Jiangxi, Guangxi, and Fujian, are also near the top, as is nearby Guizhou. Shanghai and the three provinces that surround it, namely Jiangsu, Anhui, and Zhejiang, are also near the top (or in Zhejiang’s case, the middle).
The biggest outlier, though, was the northeastern province of Heilongjiang, which apart from Guangdong had the most large strikes adjusted for GDP size. Heilongjiang has been a major oil and coal producing province, which may partially help to explain this. Strikes in the province have been putting its governor Lu Hao, the youngest provincial governor in the country, under a lot of political pressure of late.
Heilongjiang’s position also highlights an interesting trend: China’s most peripheral provinces, like Tibet, Guangdong, Heilongjiang, Xinjiang, Guangxi, Yunnan, Qinghai, Inner Mongolia, Hainan, and Jiangxi, are either at the very top of the list or at the very bottom of the list. Heilongjiang itself has the longest international border in China outside of the three “autonomous regions” of Tibet, Xinjiang, and Inner Mongolia: Heilongjiang’s border with Russia is only slightly shorter than the US-Mexican border, something Donald Trump almost certainly couldn’t tell you.
The China Labour Bulletin maps also zoom in to show which cities in the strikes occurred in, and gives basic information about them. For example:
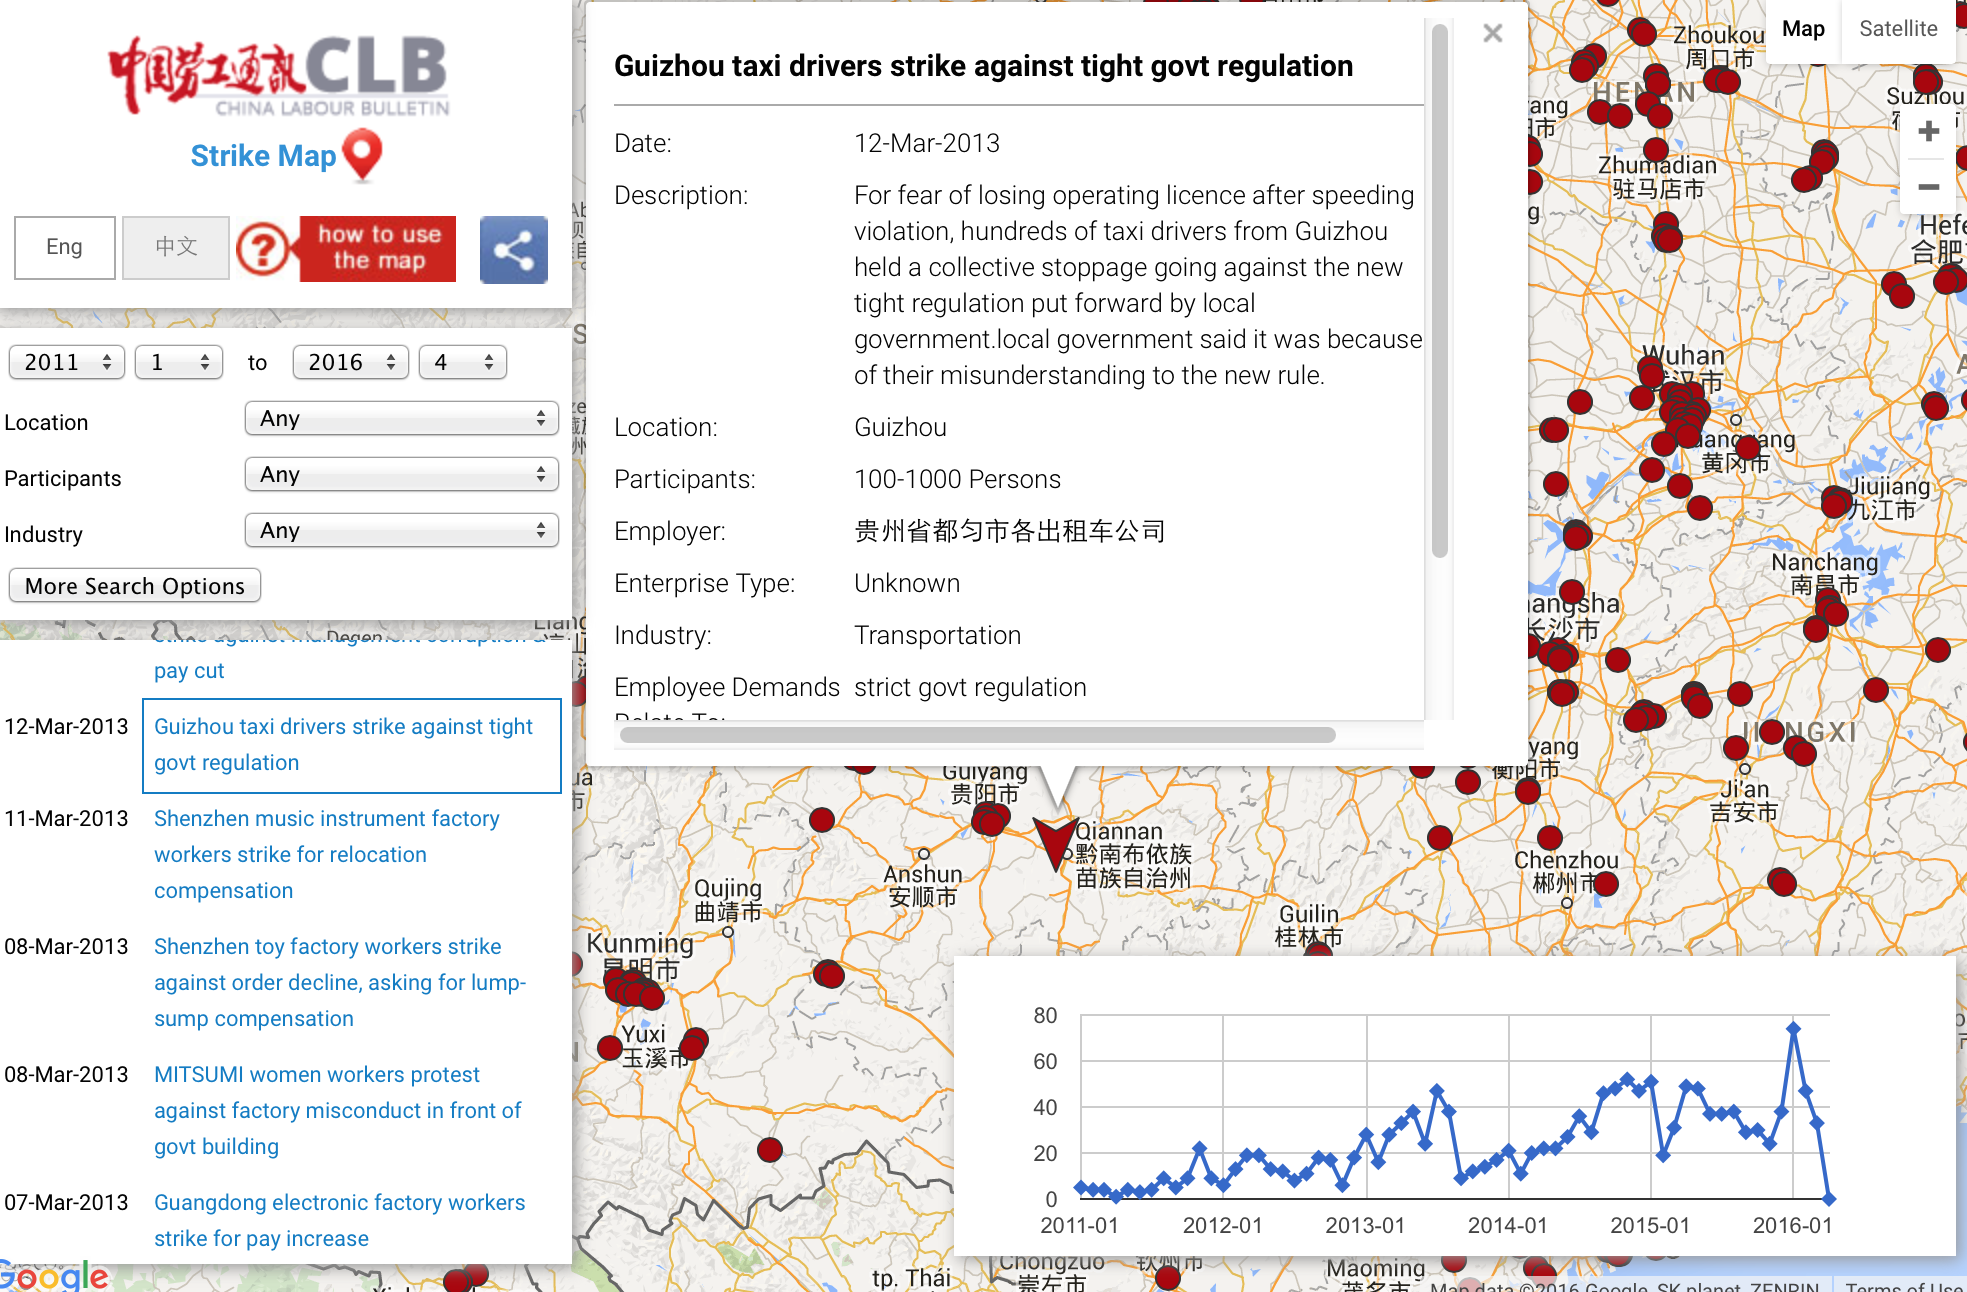
It also breaks down the strikes by the response they are thought to have received, in five categories: “police”, “arrest(s)”, “government mediation”, “negotiation”, or “other”. According to the site, “Guangdong also led the country in the number of police interventions in labour disputes, accounting for about 19 percent of the total 831 incidents in which police were deployed and 24 percent of the incidents in which arrests were made”.
“Worker protests accounted for 38 percent of all mass protests by Chinese citizens last year, according to statistics published on the well-respected Wickedonna blog.”
To close, here are there numbers of strikes of all sizes since the beginning of 2015, adjusted for provincial population size and provincial GDP size. Guangdong is finally not at the top of either:
Disclosure: None.


Personally, I found this article fascinating.
What does this mean to me as an investor? I read the whole thing but didn't learn anything I can use - what am I missing?
Well, on its own the article does not provide any insight on how you should invest. I am interested, though, in the question of how much regionalism there is in modern-day China. Historically China has been prone to a lot of regionalism, and Guangdong in particular has been something of a revolutionary region from the point of view of many Chinese central governments. That was why I was interested to find so many regional patterns - including some core-periphery regional patterns - in the GDP-adjusted graph of large labour strikes in recent years. And especially to find Guangdong way out in front in this category, with twice as many GDP-adjusted large labour strikes of any other province, and about five times the national average. In general, the more regionalism there is within China, the greater pressure there is on a central government to avoid liberalizing the Chinese economy. Those who understood that China was a lot less of a monolithic country that it was often portrayed were less likely to have been suckered by the China and BRICs investment bubbles of a few years ago.
Very good point.
I read through this twice but since I'm not writing a term paper on China, mystified as to what good it does me....
I thought you did forecasting - what are you forecasting here? don't understand what this means.