
Key Resistance EUR/USD At 1.10 And GBP/USD At 1.2250
EUR/USD
4 hour

The EUR/USD made a bullish bounce despite the downtrend but was so far unable to break above the first resistance trend line (orange). A breakout above resistance could see price continue higher as part of wave e (green), which is a larger triangle on the daily and weekly charts. A breakout below support (green) could price fall towards the next Fibonacci support.
1 hour
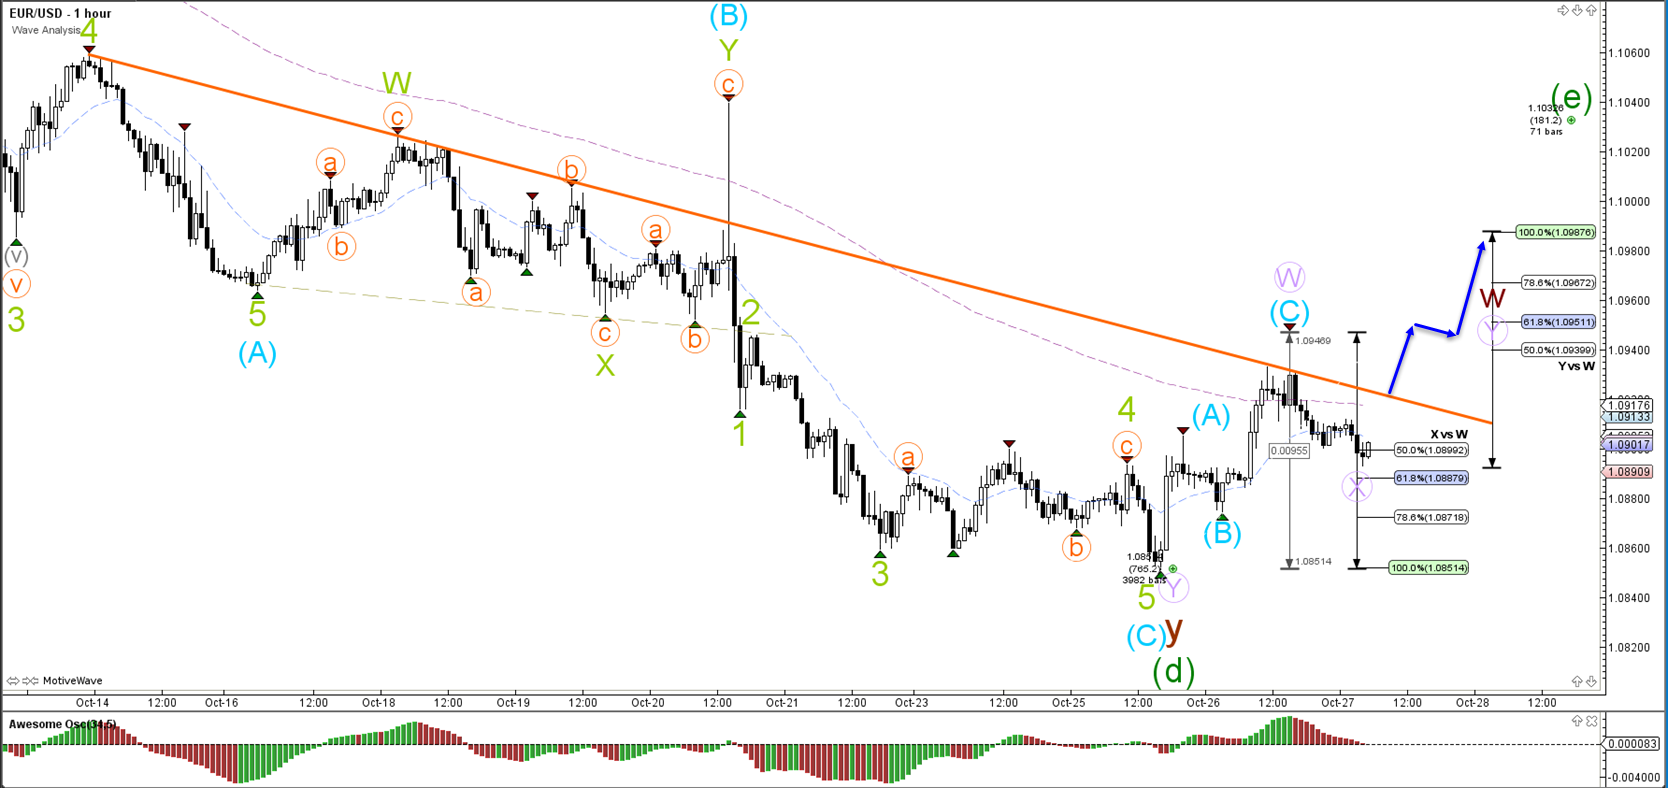
The EUR/USD completed a bullish ABC zigzag as expected yesterday (blue). This is most likely part of a larger correction indicated by the WXY (purple). A breakout above resistance (orange) could price move towards Fib targets.
GBP/USD
4 hour
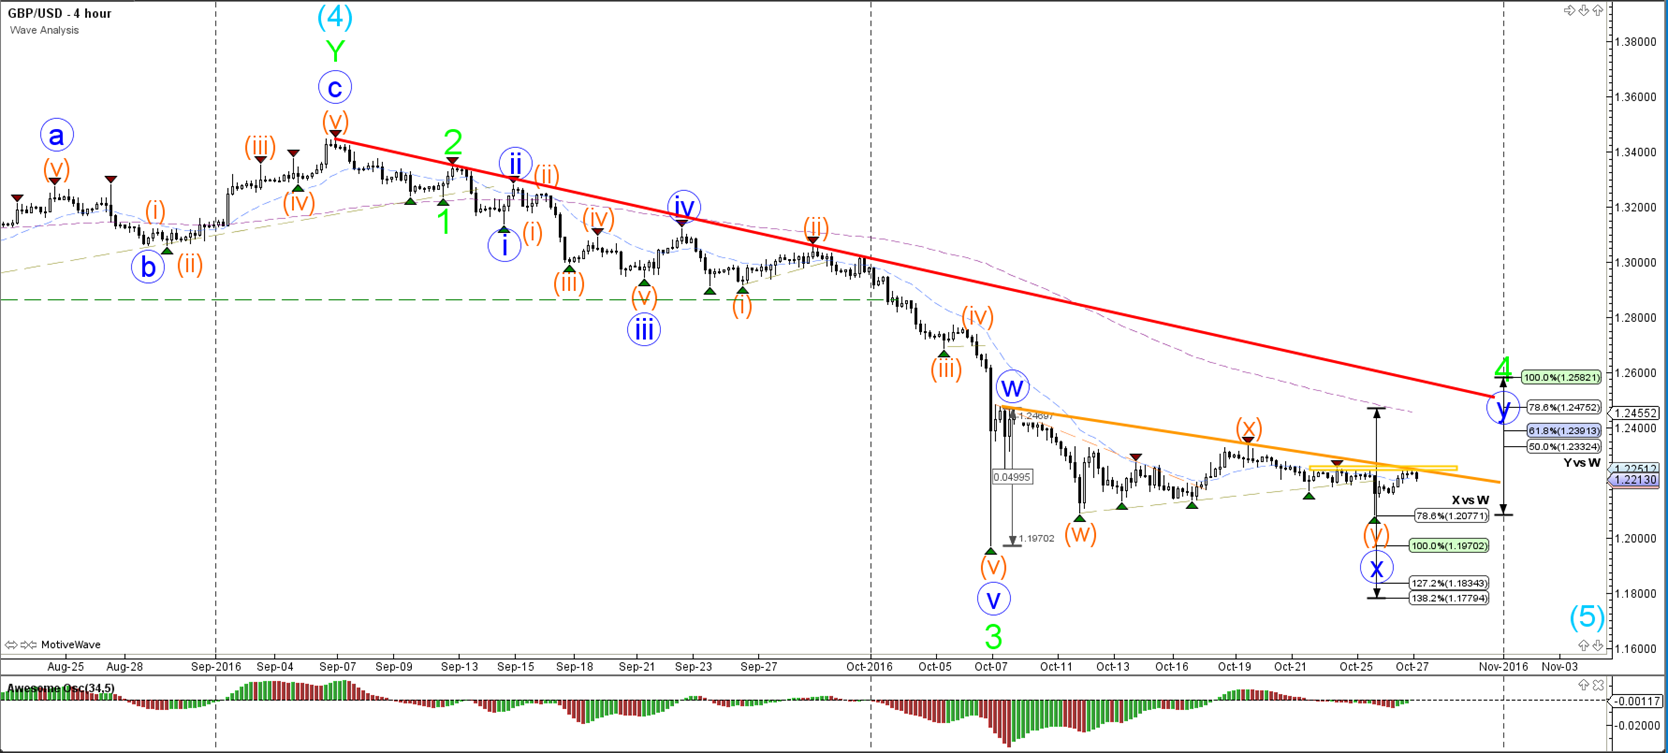
The GBP/USD showed a bullish bounce back to the resistance zone (orange), which seems to be part of a larger WXY (blue) correction.
1 hour
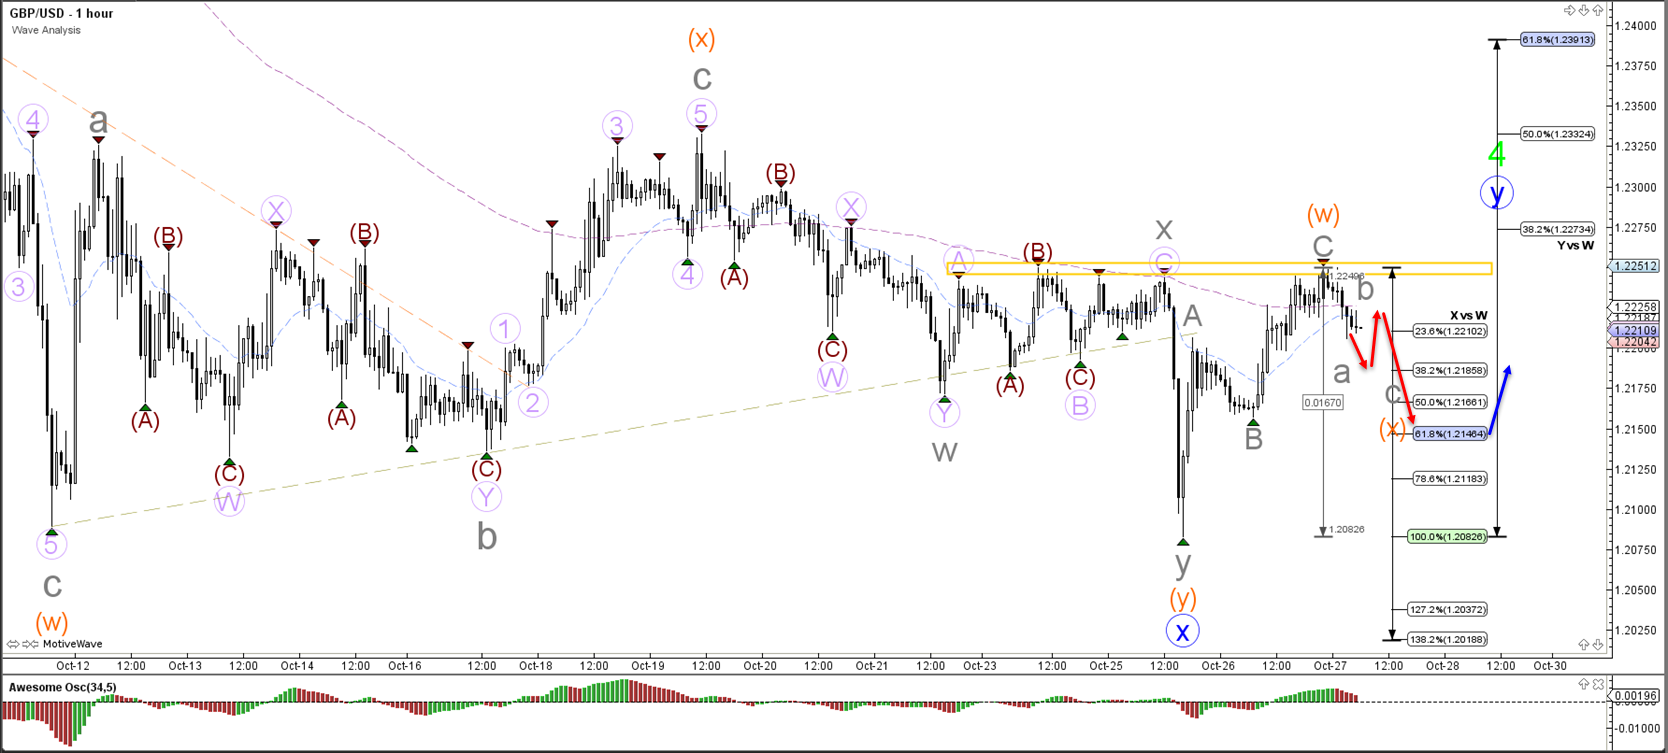
The GBP/USD completed an ABC zigzag (grey) as expected. A new bearish zigzag (grey) could take price back to the Fibonacci support levels of wave X (orange).
USD/JPY
4 hour
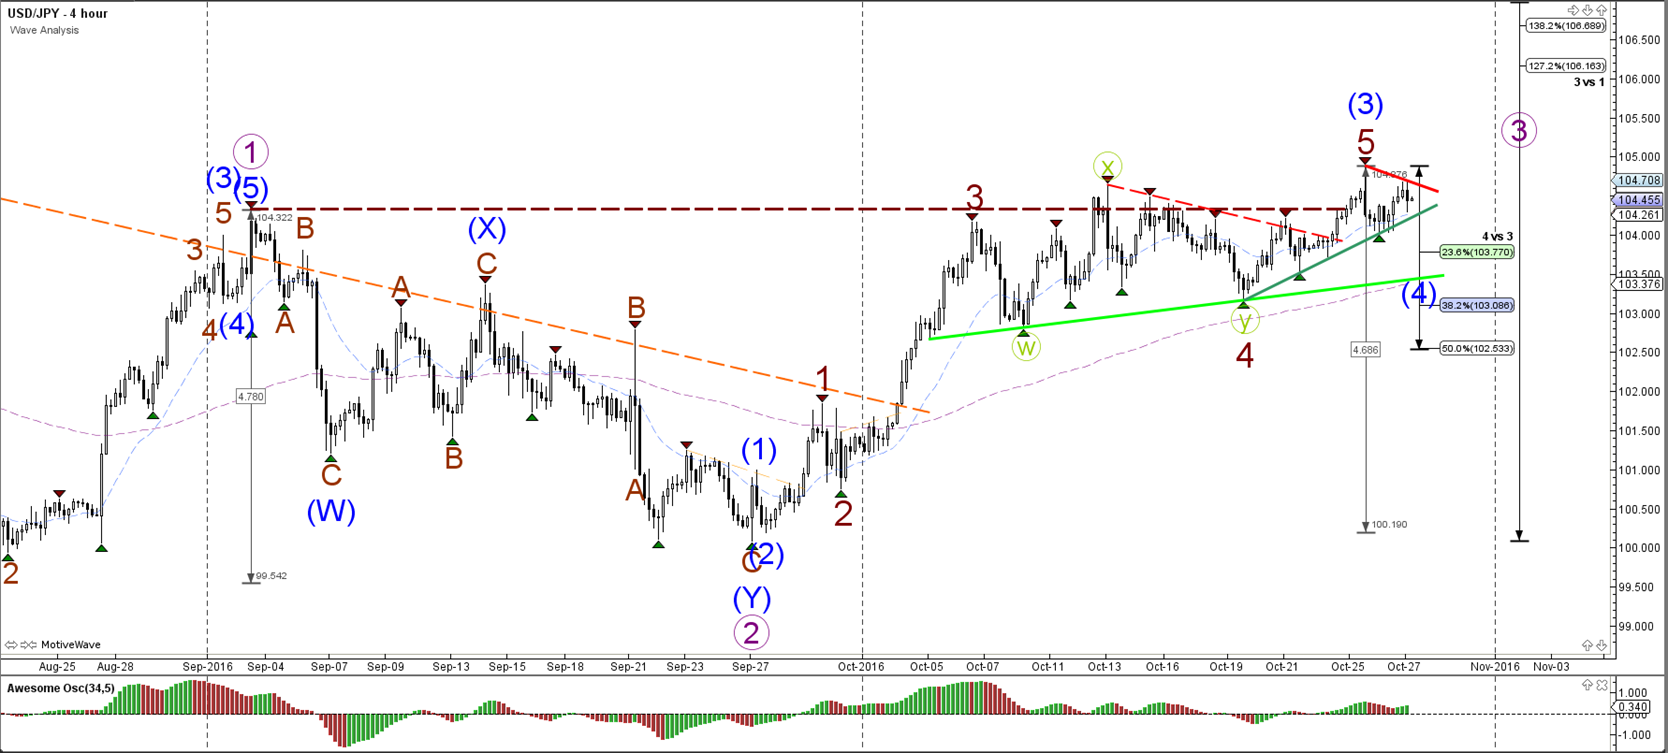
The USD/JPY is in a small triangle with support (green) and resistance (red) trend lines nearby. A bearish retracement could see price bounce at the Fibonacci levels of wave 4 (blue).
1 hour
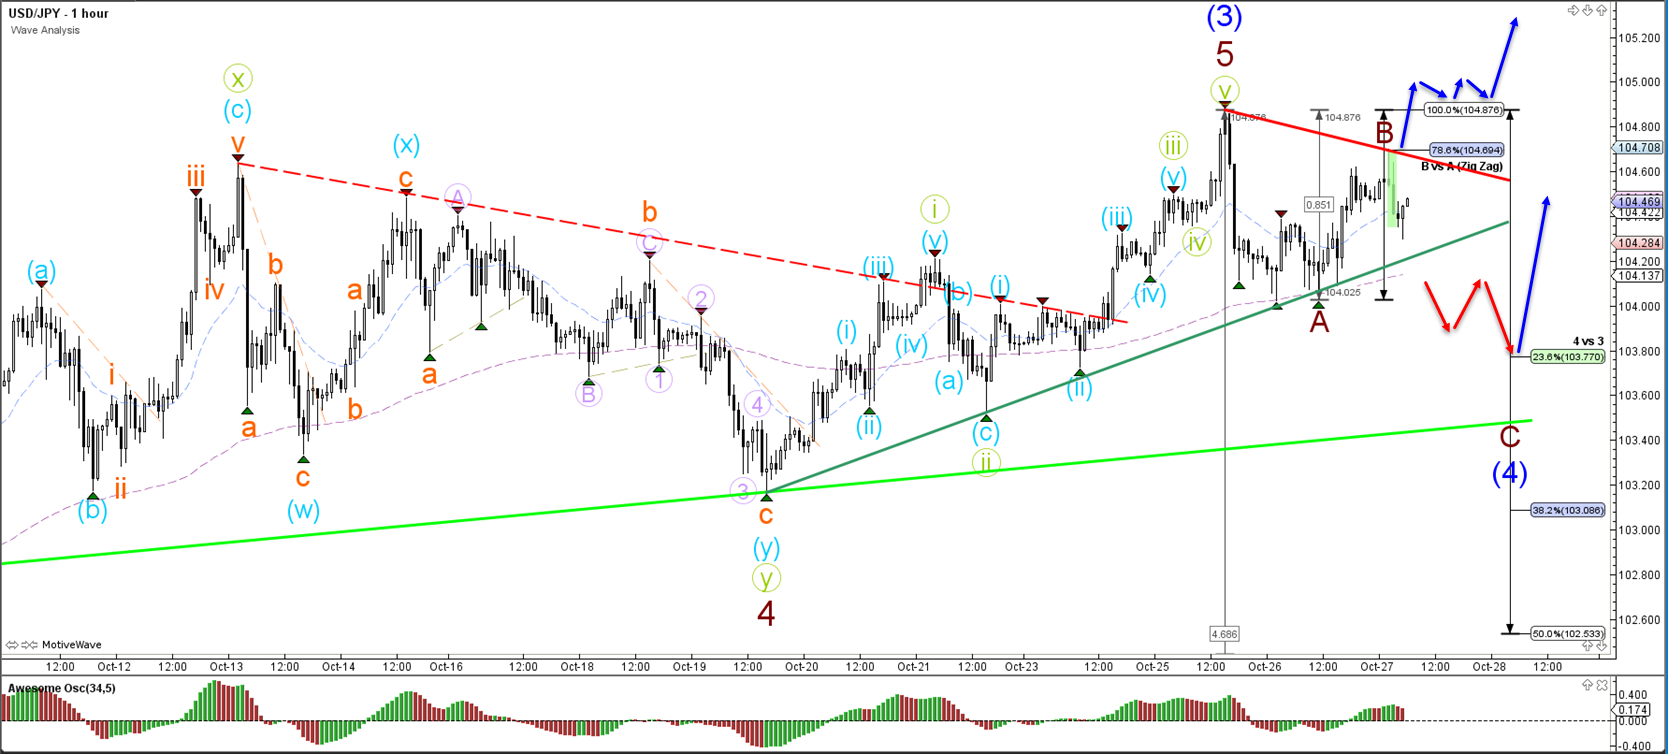
The USD/JPY could break above resistance (red) which would indicate a chance for price to continue with its uptrend momentum.
Disclosure: None.


