
Is Gold Pricing In A Hawkish Fed ‘Dot Plot Chart’?
The Fed’s dot plot chart released in December said the central bank could hike rates three times in 2017. Just three weeks back, no one thought the Fed would hike rates in March. However, the consensus still existed back then that the Fed would hike rates three times in 2017. But most experts believed the Fed would press the button after the details of the Trump fiscal plan are revealed.
Fast forward three weeks and the March rate hike is almost a done deal… courtesy of the hawkish talk by Yellen & Co.
Monthly chart
(Click on image to enlarge)
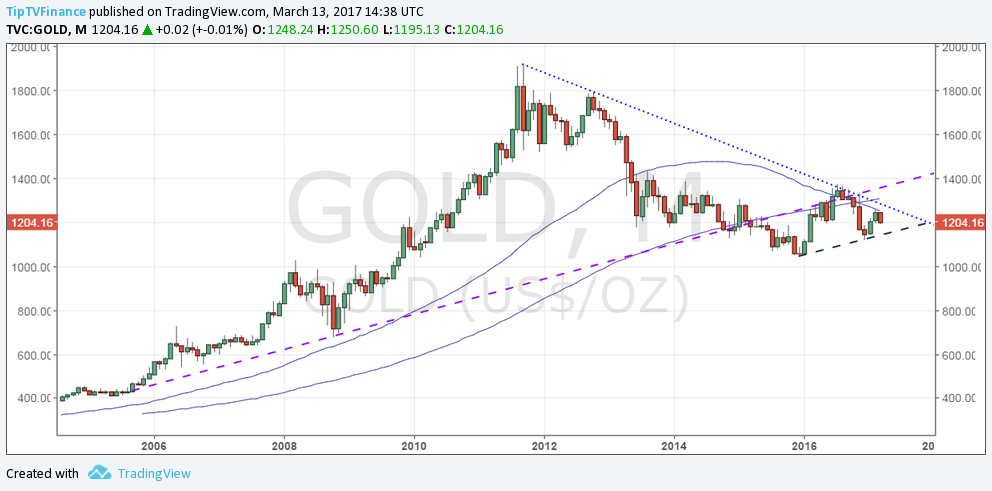
- The metal was rejected at $1263 (monthly 50-MA) in late February as the talk of a March rate hike gathered pace.
- Over the last two weeks, the metal dropped from $1250 to $1195 levels.
- Note that the markets still see only three rate hikes in 2017… i.e. only two rates hikes following a rate hike this week.
- Thus, it is quite clear the drop in gold is more due to a sudden rise in the March rate hike probability… and not due to fear of faster Fed rate hikes (hawkish Fed dot plot)
The risk of “Buy the fact”
A 25 basis point rate hike and an unchanged interest rate dot plot could result in “Buy the fact” action in the gold market. The metal could revisit the monthly 50-MA seen today at $1253 levels, above which a major hurdle is seen at $1284 (resistance offered by the descending trend line drawn from 2011 high and 2012 high).
Hawkish Dot Plot could yield a break below rising trend line support
A rising trend line drawn from Dec 2015 low and Dec 2016 low is seen offering support at around $1140 levels.
A hawkish dot plot - upward revision of long-term interest rate projections and/or the other three rate hikes in 2017 (total of four rate hikes in 2017) would open the door for a break below $1140 and drop towards $1070 levels.
Dip demand likely
A drop to trend line support of $1140 on a hawkish Fed is likely to be short lived. This is because the real rates will remain negative even after three rate hikes. The headline CPI stood at 2.5% y/y in February. The core CPI stood at 2.3% y/y in January.
Let us assume the Fed hikes four times this year. So at year end, the interest rate would stand at 1.75%. Even then real interest rates (let us consider the Feb core CPI) would be -0.55%. Add to that the political uncertainty across Europe, and Trumpflation… thus, dips are likely to be short-lived.
Disclosure: None.


