Indian Indices End Day Flat; Oil And Gas Stocks Lead Losses
After opening the day in the red, share markets in India witnessed negative trading activity throughout the day and ended the day on a weak note. Losses were seen across most sectors with stocks in the metals sector and stocks in the auto sector, leading the losses.
At the closing bell, the BSE Sensex stood lower by 25 points (down 0.1%) and the NSE Nifty closed down by 14 points (down 0.1%). The BSE Mid Cap index ended the day down 0.2%, while the BSE Small Cap index ended the day down by 0.5%.
Asian stock markets finished mixed. As of the most recent closing prices, the Hang Seng was down by 1.5% and the Shanghai Composite was up by 2%. The Nikkei 225 was down by 1.2%. Meanwhile, European markets, were trading on a negative note. The FTSE 100 was up by 0.7%, The DAX, was down by 0.6% while the CAC 40 was down by 0.8%.
The rupee was trading at Rs 64.19 against the US$ in the afternoon session. Oil prices were trading at US$ 64.51 at the time of writing.
In news about the economy. Market participants are closely watching the minutes of The Reserve Bank of India's (RBI) bi-monthly monetary policy meet.
The Monetary Policy Committee of the RBI, which kept the policy repo rate unchanged in its February 7 policy review expressed concern about continued inflationary risks, citing factors including high food and global crude oil prices and the government's decision to increase spending for the year starting in April to support a struggling agricultural sector.
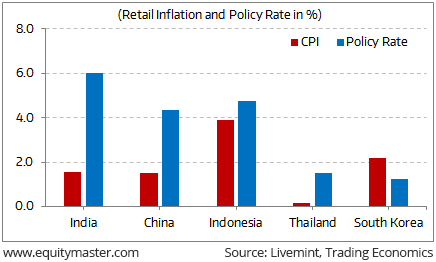
The MPC voted 5-1 at the meeting to keep the policy rate on hold at 6 per cent and to retain its neutral monetary policy stance. RBI Executive Director Michael Patra was the sole member to vote for a 25 basis point hike.
The minutes released on showed widespread concerns among the six MPC members about inflation, which accelerated to a 17-month high of 5.2% per cent in December from a year earlier, driven higher by food and energy.
India's Policy Rates Compared to Asian Economies

The RBI's monetary statement in December had projected quarterly average inflation in the range of 2-3.5% in the first half of fiscal 2018, and 3.5-4.5% in the second half. Now it expects inflation to be about 4% by the year end.
Rate cut or not, we do not attempt to predict how and when macroeconomic developments will unfold. Instead, we focus on the fundamentals and the underlying business strength of companies. The ValuePro team is always on the lookout for all-weather stocks whose fortunes are not tied to economic cycles.
In news from . As many as 5.5 million GST returns have been filed for the month of January, so far according to the GSTN Chairman.
The last date for filing initial GSTR-3B returns for a month is the 20th of the subsequent month. Hence, the sales returns for January has to be filed by February 20. However, businesses can continue to file returns after payment of late fee.
The number is expected to go up when the government releases the GST collection figure later in the month as more businesses continue to file returns. As per official data available, in December 5.6 million GSTR-3B were filed which fetched Rs 867 billion revenue to the exchequer, while in November 5.3 million returns were filed with total revenue of Rs 808 billion. In October 5 million 3B returns were filed with revenue of Rs 833 crore, while in September it was 4.2 million with tax collection of Rs 921 billion.
The GST Council, chaired by Union Finance Minister Arun Jaitley and comprising state counterparts, had in November decided to slash late filing fee in order to help businesses cope with the system and file returns even at a later date.
Businesses with 'nil' tax liability now have to pay only Rs 20 as late fee for delayed filing of return while for the rest, the fee is Rs 50.
And here's a note from Profit Hunter:
UPL Ltd. is the most actively traded stock in the market today. It is down 2% and has hit a new 52-week low.
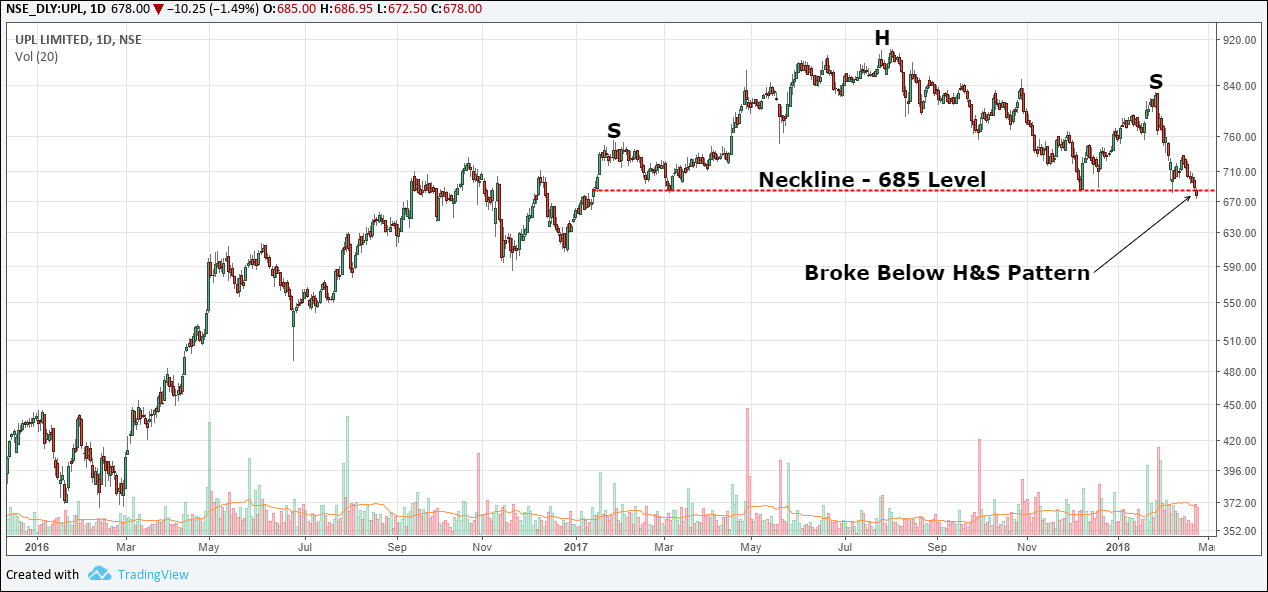
The stock bottomed out at 368 in February 2016 with the broader market indices. It traded in a smooth uptrend to hit a 52-week high of 902 in August 2017. It then start trading in a downtrend as the stock eroded 24% of its value to find support from 685 level in December 2017.
It bounced strongly from this level to touch 828 but the bulls couldn't sustain the rally as it slipped back to 685 level.
Today, the stock broke the 685 support level. The level could also be seen as the neckline of the head and should pattern (H&S). The breakdown of the neckline indicates weakness in the price action.
So can the bulls interrupt to support the price or can we see some more weakness in the price action in the sessions to come? Let's keep a track of it...
UPL Breaks Below H&S Pattern
(Click on image to enlarge)

Disclaimer: Equitymaster Agora Research Private Limited (hereinafter referred as 'Equitymaster') is an independent equity research Company. Equitymaster is not an Investment Adviser. ...
more


