How To Appreciate The Strength Of Japan’s Fundamentals
One of the most remarkable time series we have seen in 2017 regards the net positioning of non-Japanese investors in Japanese equities.1
- As of January 13, 2017, $5.1 billion had gone INTO Japan’s equities.
- As of March 24, 2017, $23.2 billion had gone OUT of Japan’s equities.
- As of July 21, 2017, $7.6 billion had gone INTO Japan’s equities.
- As of September 22, 2017, $25.5 billion had gone OUT of Japan’s equities.
- As of November 17, 2017, $12.2 billion had gone INTO Japan’s equities.
In terms of net investor flows over the course of a given year, this indicates a rather high level of volatility, telling us that the perception of the opportunity in a Japanese equity investment has changed massively depending on the time of year in 2017.
The Tricky Aspect of Japan: Yen vs. U.S. Dollar Exchange Rate
One of the easiest measures for investors outside of Japan to monitor is the exchange rate between the yen and the U.S. dollar. We wrote recently about how there is currently a very high correlation between the level of the U.S. 10-Year Treasury note and the level of the yen versus U.S. dollar exchange rate.2
As of this writing, this exchange rate is about 111.5. During the last three months, the yen has been as strong as 107.8 and as weak as 114.2. Before Abenomics began, during the fourth quarter of 2012, the yen was all the way around 80. Sometimes, we get the impression that non-Japanese investors would have preferred to see a nice, smooth trend from 80 all the way up to 130 and continuing.3
Since this hasn’t happened, other very positive aspects of Japan’s equities have been masked, in our opinion.
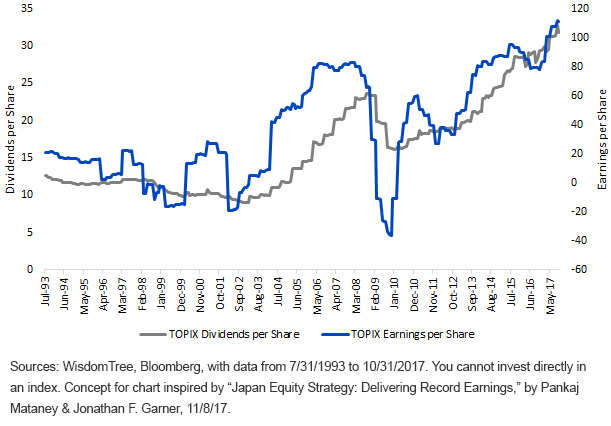
TOPIX: Record High Dividends & Earnings per Share (July 31, 1993, to Oct. 31, 2017)

- Since November 30, 2012, approximately two weeks prior to the initial election of Prime Minister Abe, the TOPIX has delivered a cumulative return of more than 150%—better than 20% per year. That compares to the S&P 500 Index at 15.4% per year and the MSCI EMU Index at 11.4% per year.4 One of the more consistent behavioral relationships has been that investor flows follow performance, but it’s amazing that there is such a lack of faith in Japan among foreign investors that this hasn’t really been the case.
- What we can clearly see is that the TOPIX earnings per share and dividends per share are at record highs (even though price levels are nowhere near the late 1989 Japan bubble levels). What this has meant for investors is that Japan’s price-to-earnings (P/E) ratio has dropped by 7.3% per year from November 30, 2012, to November 24, 2017. During this same time, the S&P 500 Index P/E ratio rose by 8.6% per year, and the MSCI EMU Index P/E ratio rose by 6.9% per year.5
Japan’s market was outperforming AND the stocks were becoming less expensive.
Earnings per Share & Dividends per Share of TOPIX Small Index Are at Record Highs
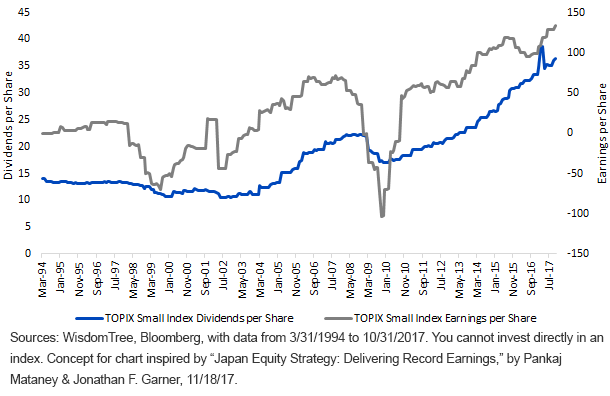
TOPIX: Small Index: Record High Dividends & Earnings per Share (March 31, 1994, to Oct. 21, 2017)

- Similarly, from November 30, 2012, to November 24, 2017, the TOPIX Small Index returned 177.80% cumulatively, or nearly 23% per year. That compares to a Russell 2000 Index that returned 14.7% per year and the MSCI EMU Small Cap Index return of 17.9% per year.6
- During this same period, the P/E ratio of the TOPIX Small Index increased by only about 1% per year, again because the earnings per share of this Index are also at record highs. This is hugely significant, especially at a time when investors, particularly in U.S. small-cap stocks, have been so concerned with expanding valuations.7
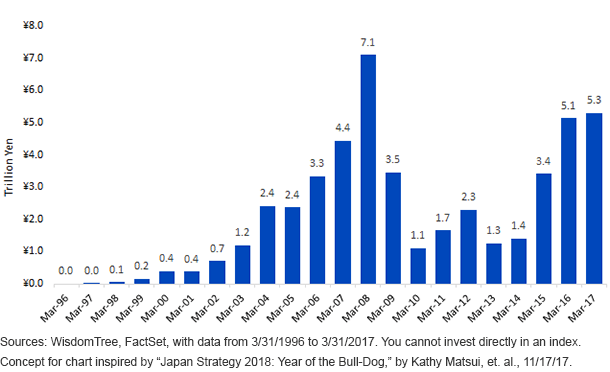
Share Buybacks in the MSCI Japan Index Have Been Accelerating during Abenomics

- Notably, the Bank of Japan has implemented a process wherein it purchases 6 trillion yen of equity ETFs per year.8 As of March 31, 2017, we saw the MSCI Japan constituents buy back 5.3 trillion yen of their shares over the prior 12-month period. Since the commencement of Abenomics, we’ve seen Japan’s share repurchases accelerating, and we think it’s possible that they will soon eclipse the equity ETF purchases of the BOJ. There is an awful lot of cash still on Japan’s corporate balance sheets, so we believe things like dividends and buybacks can continue to grow.
Japan Could Be an Interesting Long-Term Investment Theme
The conclusion that Japan can be an interesting long-term investment theme is not a new one for WisdomTree, but we strongly believe the fundamentals story and plan to keep focusing on it.
1Sources for following bullets: Bloomberg, Japan Ministry of Finance. Data is reported weekly.
2Sources: WisdomTree, Bloomberg, with period from 9/21/16 to 11/21/17, the period after which the Bank of Japan established a policy to keep the interest rate on the 10-Year Japanese government bond close to 0% with unlimited bond purchases.
3Source for all data in this paragraph: Bloomberg. Current data is as of 11/24/17. Past three months extends back to 8/24/17. Fourth quarter of 2012 is from 9/30/12 to 12/31/12.
4Performance data source for bullet: Bloomberg, with data from 11/30/12 to 11/24/17.
5Sources: WisdomTree, Bloomberg.
6Sources: WisdomTree, Bloomberg.
7Sources: WisdomTree, Bloomberg.
8Source: “New Framework for Strengthening Monetary Easing: Quantitative & Qualitative Monetary Easing with Yield Curve Control,” Bank of Japan, 9/21/16.
Disclaimer: Investors should carefully consider the investment objectives, risks, charges and expenses of the Funds before investing. U.S. investors only: To obtain a prospectus containing this ...
more


