
Gold Shines On The Weekly Chart
If the latter part of 2016 was one to forget for gold bugs, the start of 2017 has certainly been one to remember with the precious metal finally finding some much needed bullish momentum. The recovery in gold, which has seen it move off the lows late 2016 and the $1130 per ounce area to currently test the $1300 per ounce area, has been driven by three distinct and very different forces. First, of course, comes the impact of the US dollar, which continues to trade with an increasingly bearish sentiment on the slower timeframes, as disunity in the FED, coupled with disbelief from the markets and statements of a weaker dollar from Trump Towers, have all helped to weaken the currency of first reserve. But as always one man’s loss is another man’s gain, and so it is here for gold and its relationship to the US dollar. Second, comes a flight to safe haven, and with tensions rising in the South China seas, gold is likely to continue to move higher driven by those seeking out a hard asset for safety. Third and last comes the inflation effect, and whether the US economic data is to be believed or not, rising interest rates will ultimately signal rising inflation, and for gold, this is likely to be reflected in buying as a hedge against inflation.
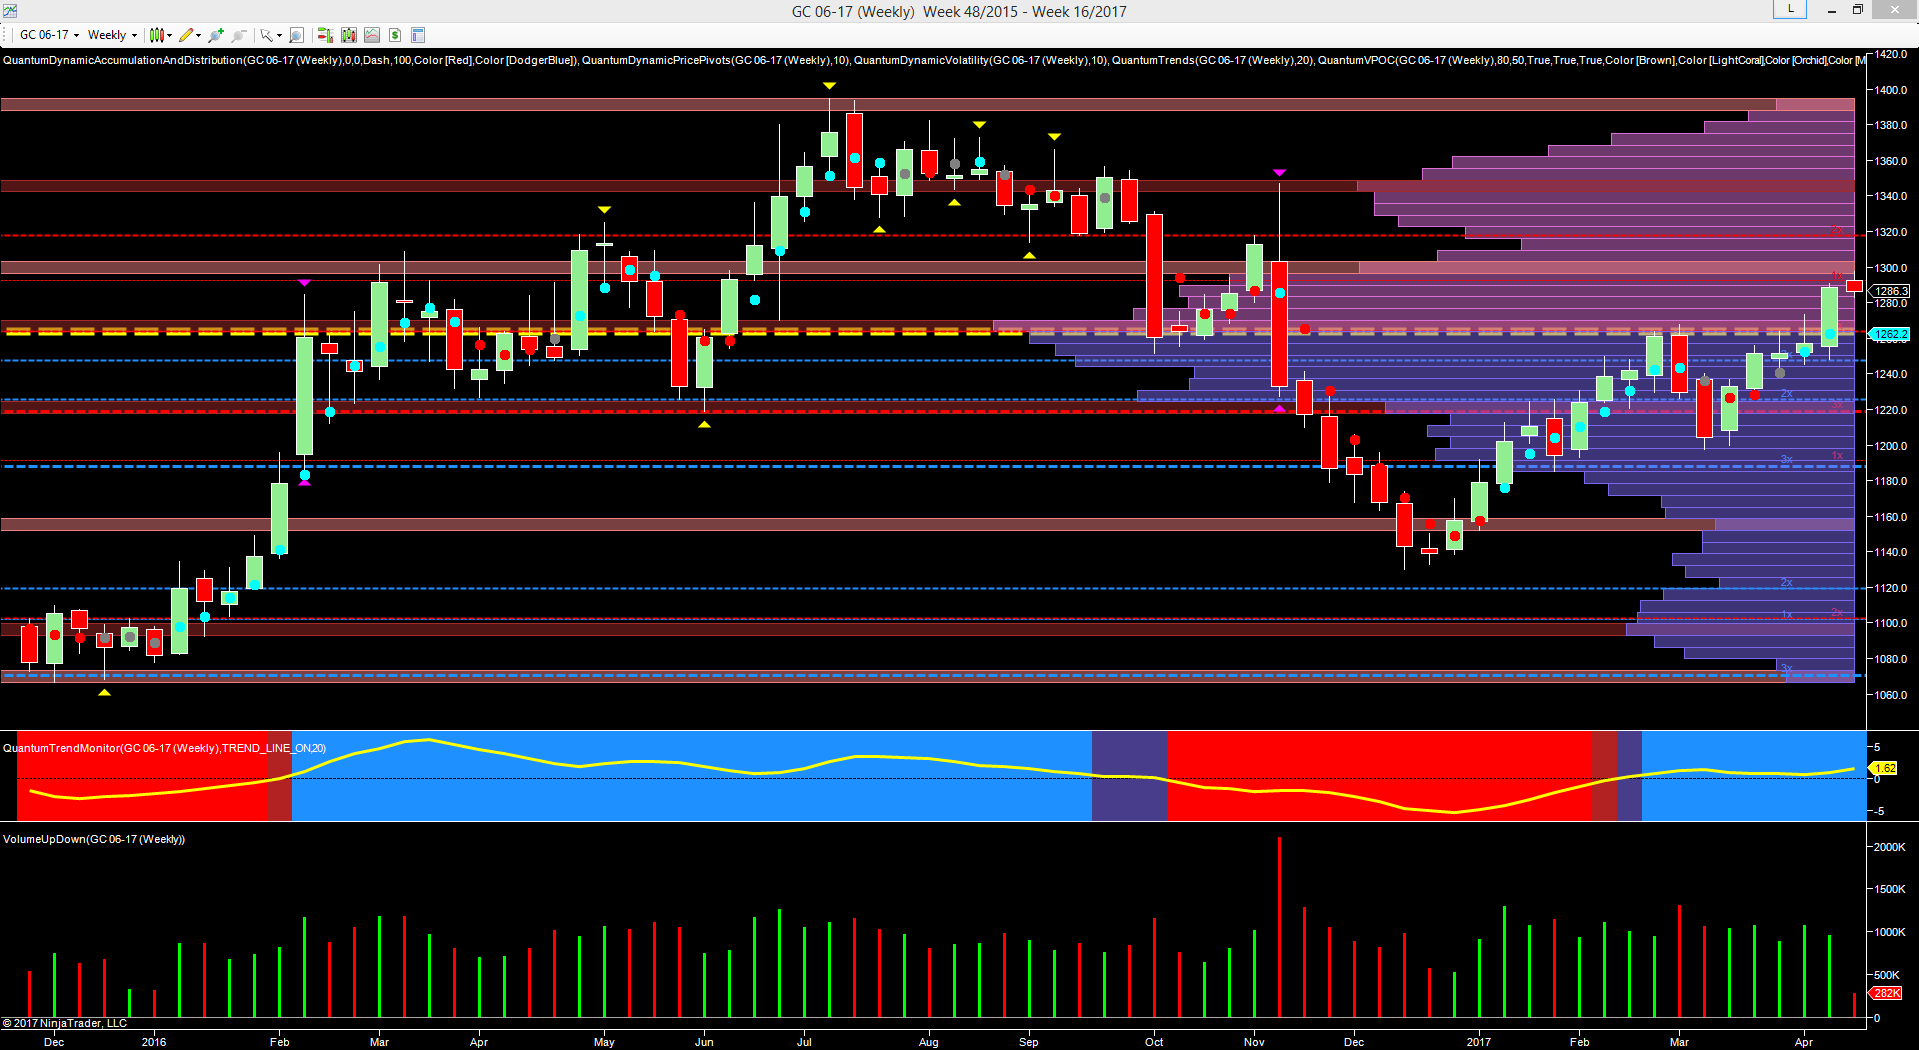
From a technical perspective, and in particular a consideration of volume price analysis on the weekly chart, what was perhaps most pertinent was the price action of November and December. This was characterized with seven weeks of falling price action, but accompanied by generally falling volume and in contradiction of Wyckoff’s third law. What we should have expected to see here, would be rising volume in a falling market and confirming the move lower as it takes effort for a market to fall as well as to rise. Whilst this period was also subject to the seasonal effect, nevertheless, the move lower lacked conviction and big operator participation with the bearish trend finally bottoming out in the $1130 per ounce area. Come the new year and bullish sentiment prevailed with rising volume supporting the initial move higher in January with February’s price action taking gold back to the volume point of control at $1262 per ounce, with short-term weakness then replaced with further bullish sentiment from mid-March, and supported once again by solid price action and associated volume.
The problem now is gold is approaching two deep areas of price congestion on the weekly chart. The first of these is immediately ahead and indeed straddles the VPOC itself with the ceiling of resistance marginally above the $1300 per ounce area. If this is taken out, the next region then awaits and extending from $1320 per ounce through to $1400 per ounce region, last seen in the summer of 2016. So volumes will now be key to the development of the bullish trend for both these regions to be punctured, and if so we will need to see strong and well developed price action coupled with strong and rising volume. For the time being, we are trading at the volume point of control and as such may expect to see a period of consolidation (North Korea not withstanding), but provided the two technical levels outlined above are both taken out, then gold bugs may be cheering long into the summer on further solid gains for their beloved metal.
Disclaimer: Futures, stocks, and spot currency trading have large potential rewards, but also large potential risk. You must be aware of the risks and be willing to accept them in order to invest in ...
more

