
Gold, Oil And G6 Targets For The Week Of October 8th
This is Part Two of the regular weekly analysis of SPX, Gold, Oil and G6 currency pairs. For Part One, covering the SPX, interest rates and sector spiders click here.
As a reminder, we’ve added the current weekly and daily signals readings. Please note that these signals are in effect as of the close on Friday and may change as soon as the markets re-open. The SAR signals are based on the interaction between price and Gann angles drawn from swing highs and lows. On the chart they are color coded as green/buy, red/sell and yellow/hold. When the current signal is hold, we also include the preceding buy or sell signal (e.g. Buy/Hold or Sell/Hold). Hold signals followed by a buy/sell signal in the direction of the preceding buy/sell signal can be considered for pyramiding the position.
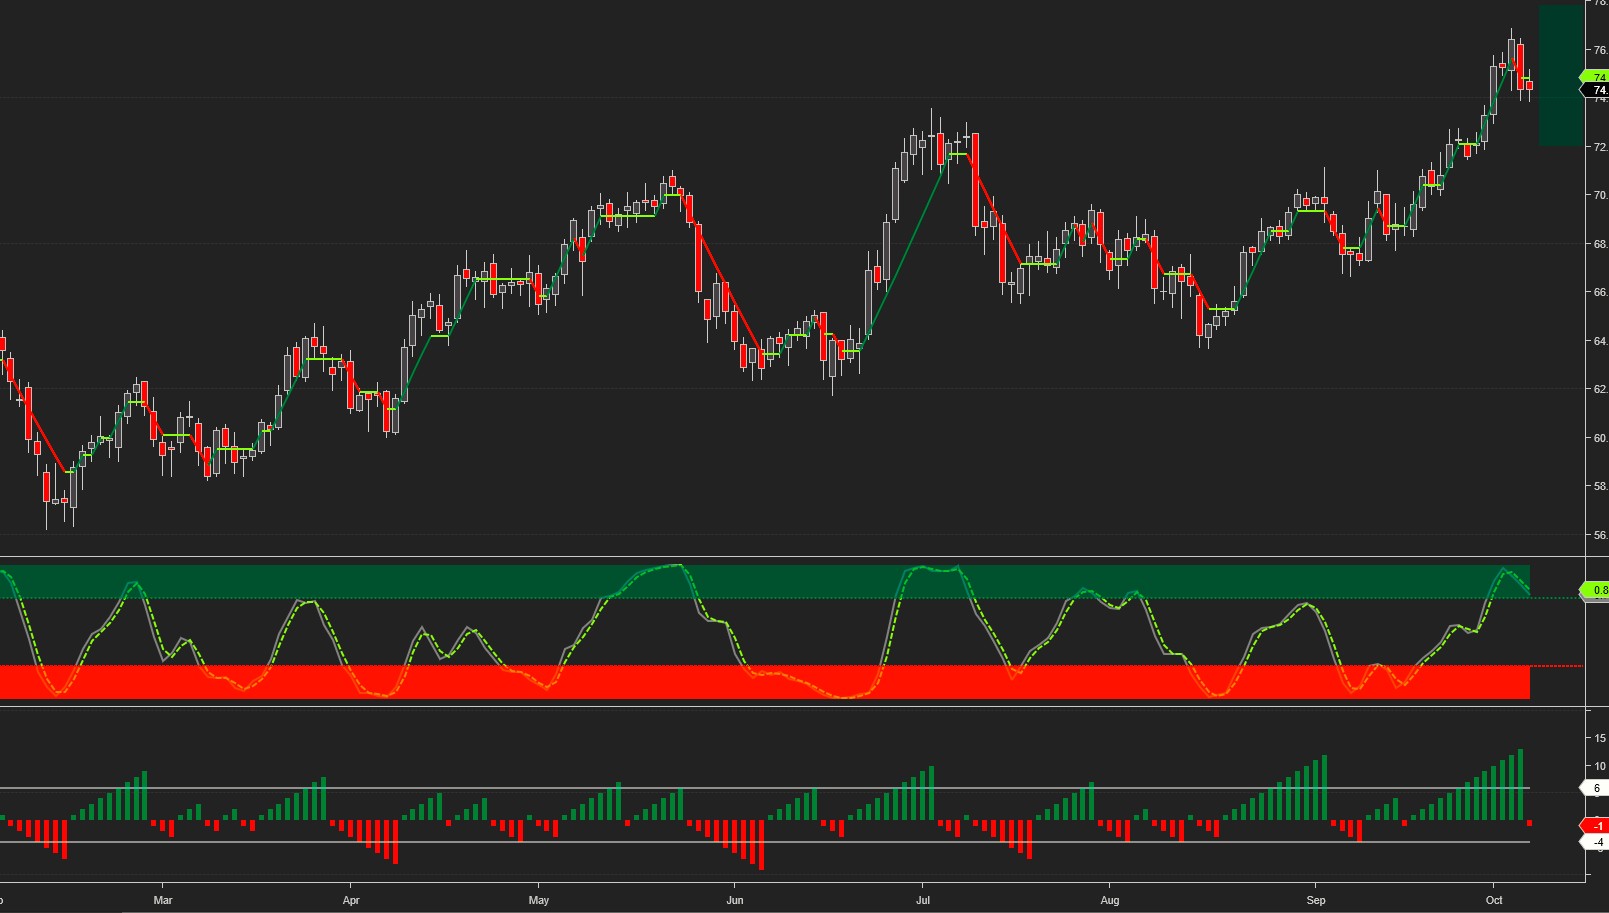
Oil traded around our upside target all week long, only to close on Friday a few cents below it.
Current SAR signals: Daily Buy/Hold, Weekly Buy.
Average up/down swing duration daily: 6/4, weekly: 4/8
Average up/down swing gain/loss daily: 4.09%/-3.02%, weekly: 6.93%/-11.26%
Monthly pivot for Oil at 73.3, S1 – 71, R1 – 76
The projected trading range for oil for next week is 72 – 78
Long RR (risk/reward) 1:1.56, Short RR 1:0.64
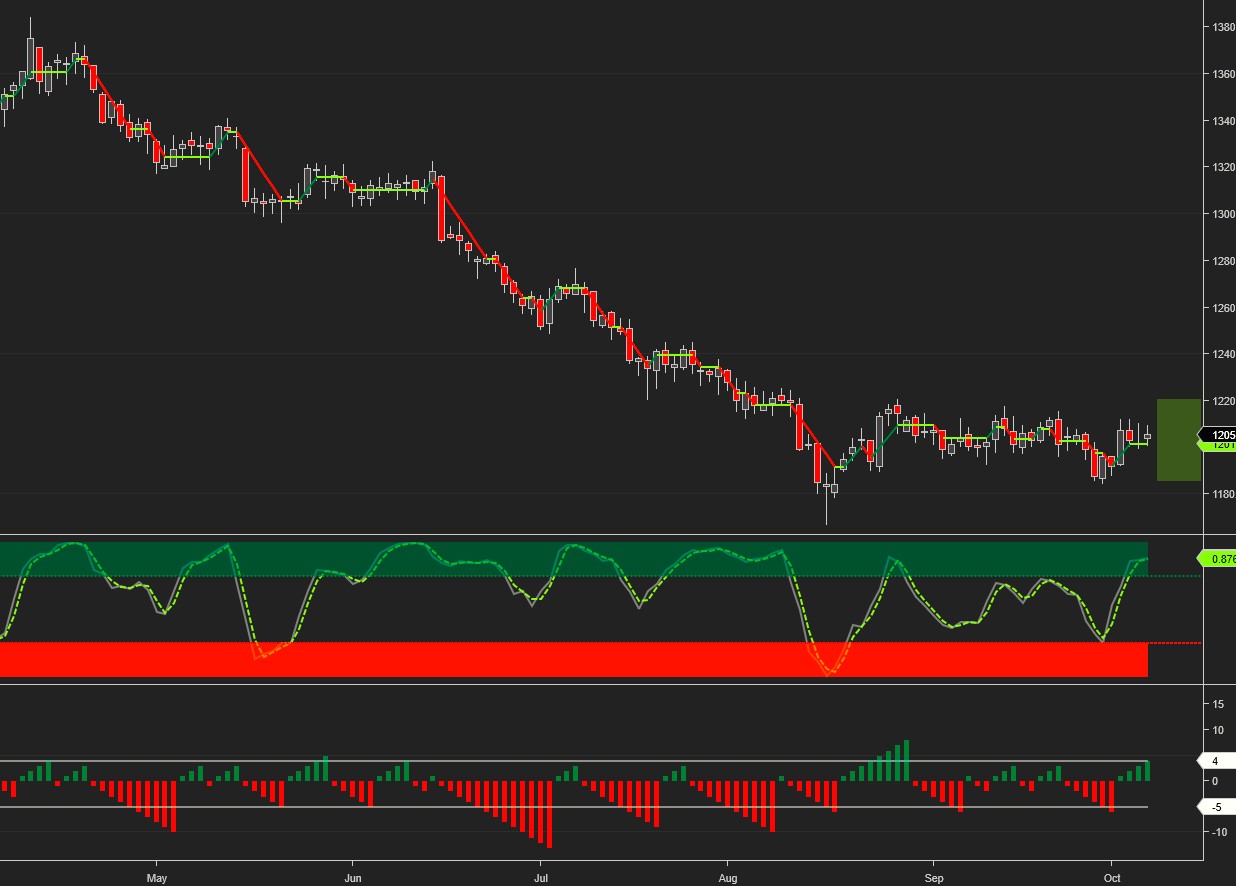
Gold tested our upside target several times but finished the week just below it. As stated before, it needs to break above 1220 for any sign of a meaningful bullish reversal.
Current SAR signals: Daily Buy/Hold, Weekly Sell/Hold
Average up/down swing duration daily: 5/5, weekly: 4/5
Average up/down swing gain/loss daily: 1.36%/-1.45%, weekly: 4.08%/-3.94%
Monthly pivot for Gold at 1196, S1 – 1172, R1 – 1220.
The projected trading range for gold for next week is 1150 – 1250
Long RR 0.8, Short RR 1.25
All G6 pairs hit our targets.
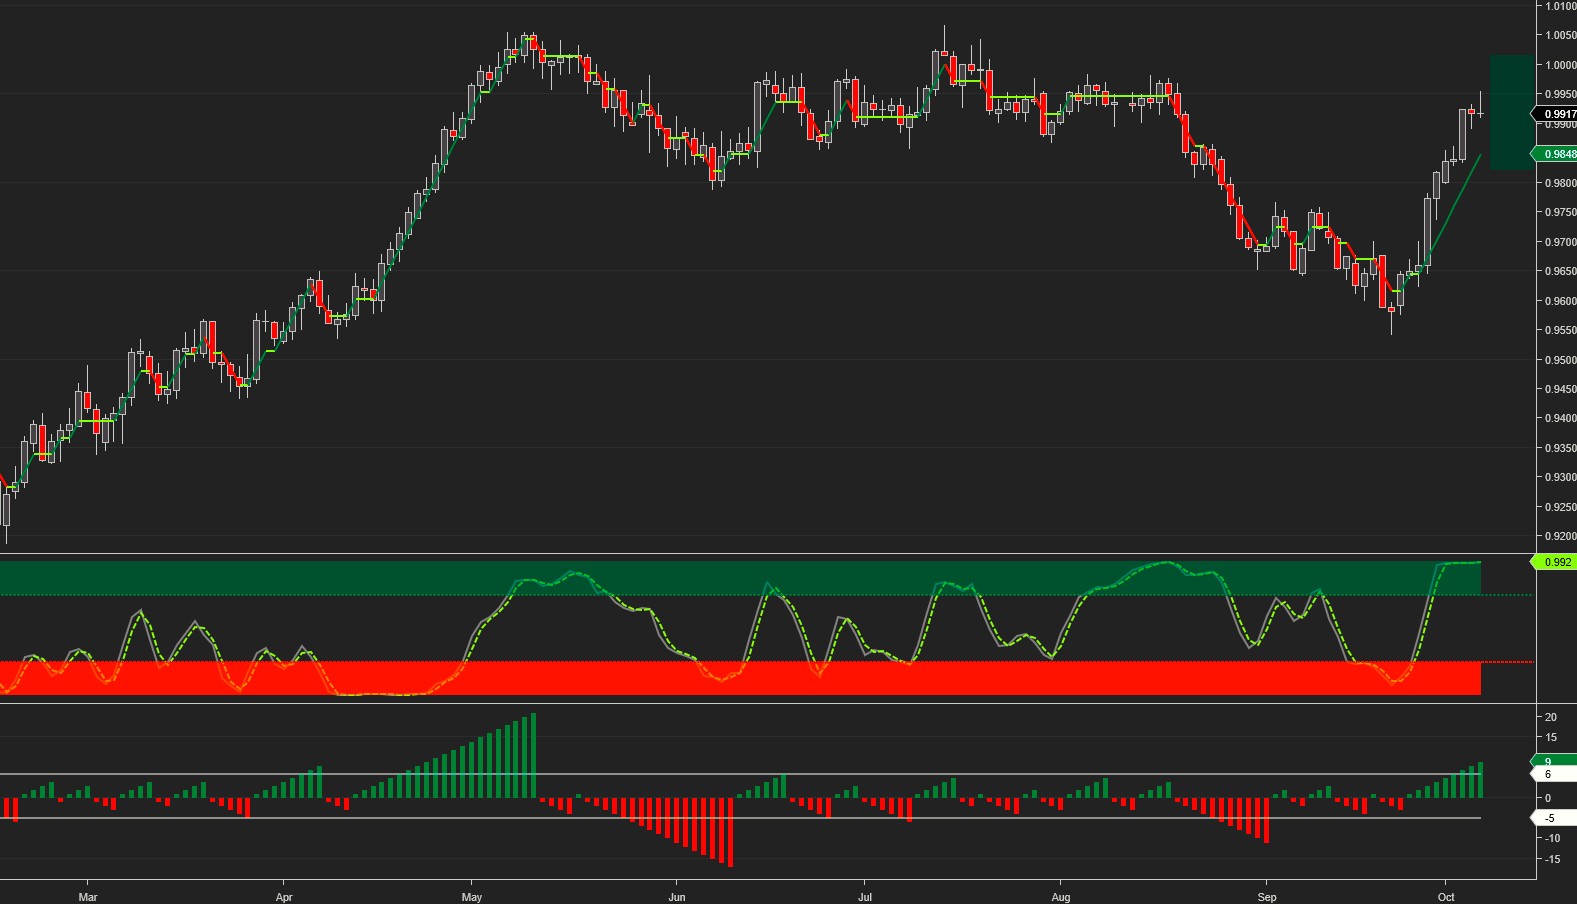
USDCHF reached our upside target on Wednesday and continued higher. Rising rates are pushing the USD towards parity with CHF.
Current trading signals: Daily Buy, Weekly Buy
Average up/down swing duration daily: 6/5, weekly: 5/3
Average up/down swing gain/loss daily: .997%/-1.12%, weekly: 2.21%/-1.73%
Monthly pivot for USDCHF at 0.981, S1 – 0.993, R1 – 0.97
The projected trading range for USDCHF for next week is 0.982 – 1.0
Long RR 0.85, Short RR 1.18
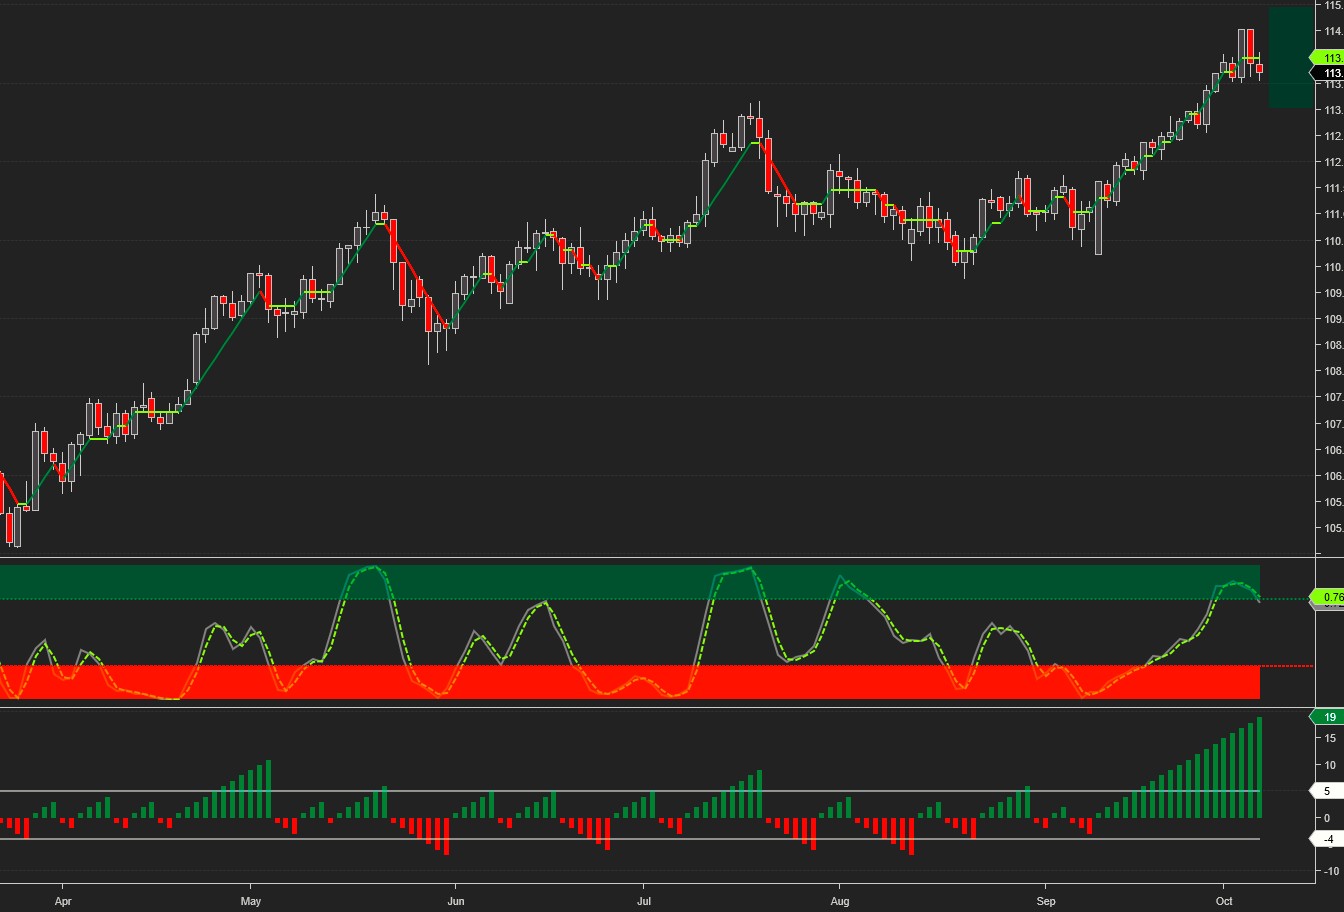
USDJPY reached our upside target on Wednesday, and pulled back towards the middle of the trading range. The daily upswing which began on 9/11 is pushing the limits of daily swing duration.
Current trading signals: Daily Buy/Hold, Weekly Buy
Average up/down swing duration daily: 5/4, weekly: 4/4
Average up/down swing gain/loss daily: .8%/-.79%, weekly: 2.94%/-2.27%
Monthly pivot for USDJPY at 113.7, S1 – 112.35, R1 –115.
The projected trading range for USDJPY for next week is 113 – 115.
Long RR 1.86, Short RR 0.54
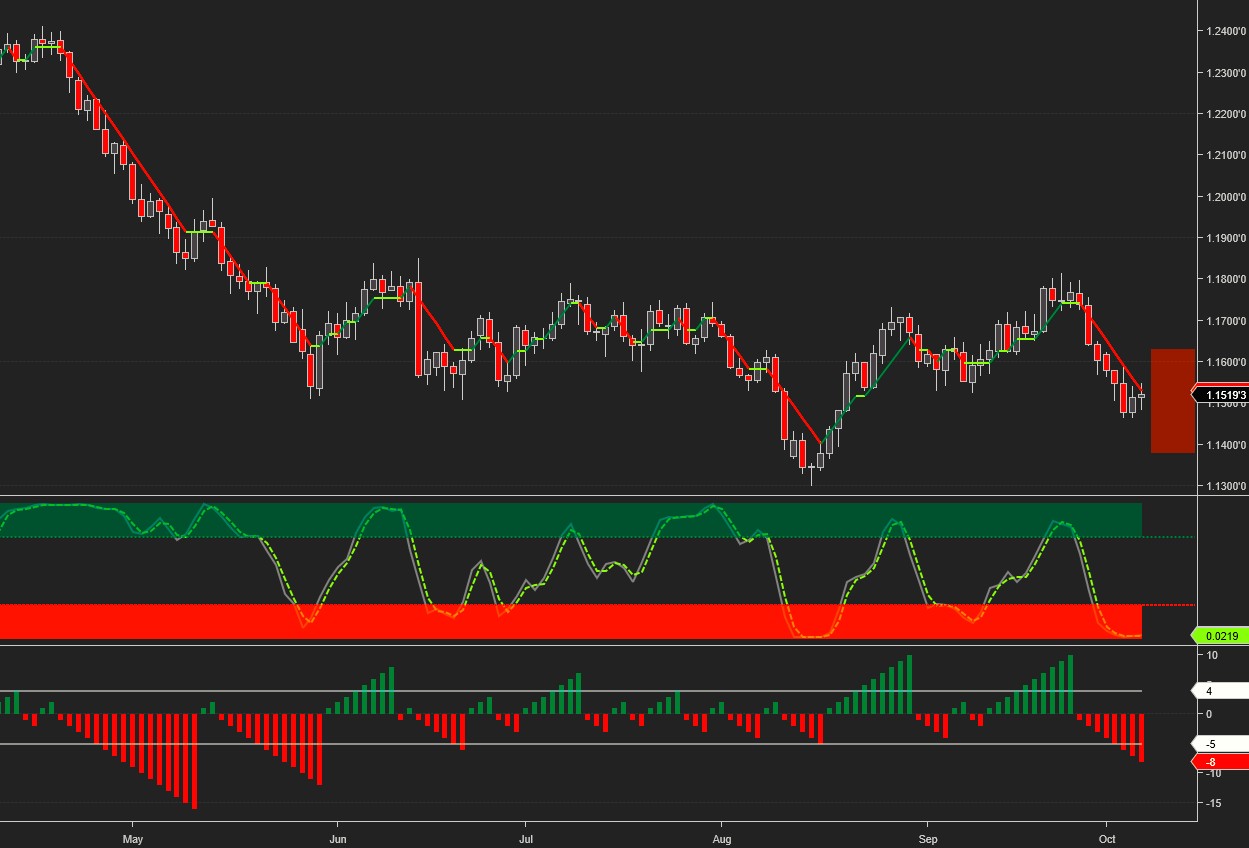
EURUSD came within a few pips of our upside target, but couldn’t hold onto the gains and reversed instead, finishing the week a few pips below our bearish target. The Euro needs to break above 1.182 against the USD for any signs of a meaningful bullish reversal.
Current SAR signals: Daily Sell, Weekly Sell
Average up/down swing duration daily: 4/5, weekly: 4/5
Average up/down swing gain/loss daily: 0.85%/-1.01%, weekly: 2.1%/-2.4%
Monthly pivot for EURUSD at 1.1617, S1 – 1.48, R1 – 1.1176
The projected trading range for EURUSD for next week is 1.138 – 1.163
Long RR 0.8, Short RR 1.25
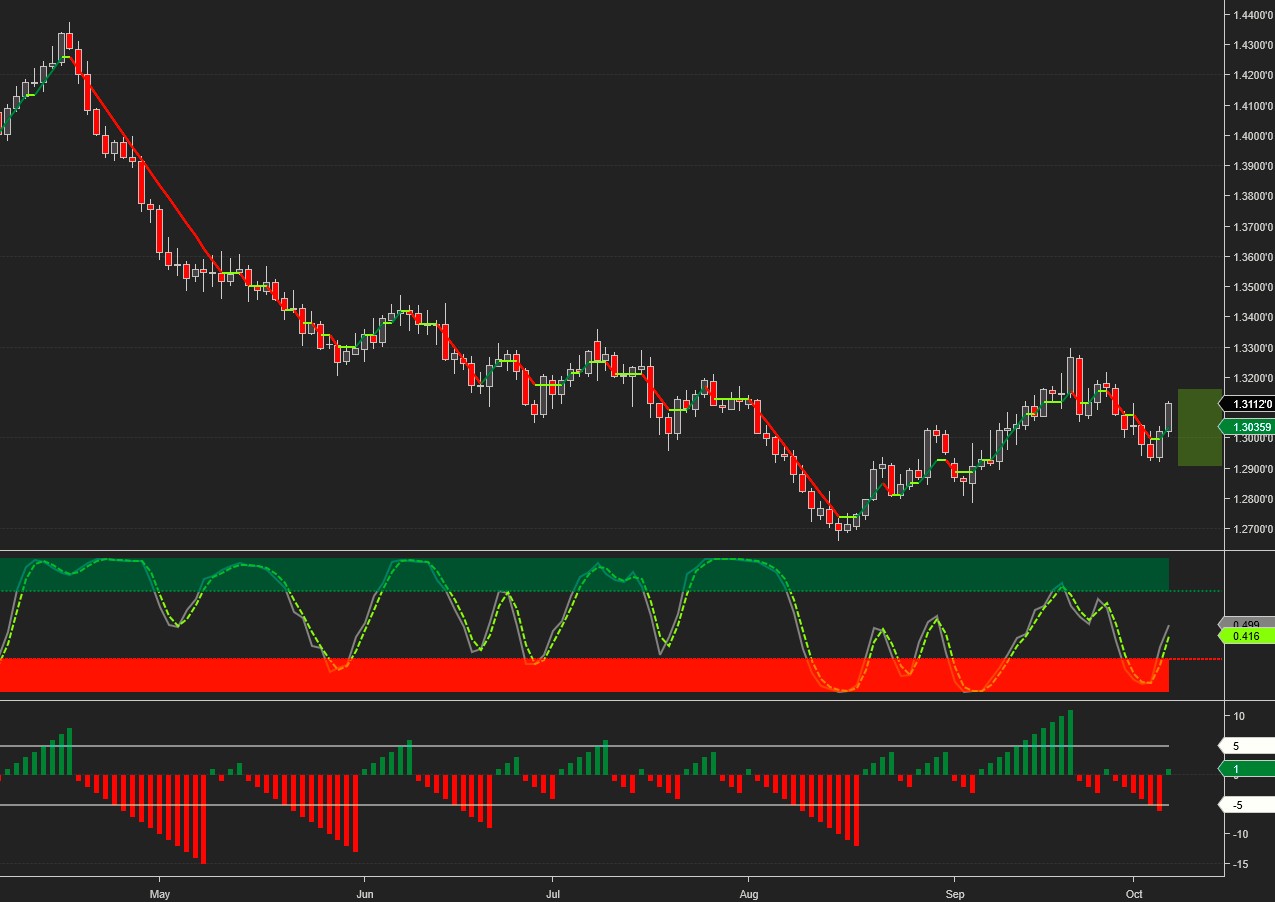
GBPUSD tested the bearish target twice, then broke to the upside and staged a powerful rally.
Current trading signals: Daily Buy, Weekly Buy/Hold
Average up/down swing duration daily: 5/5, weekly: 4/5
Average up/down swing gain/loss daily: .098%/-1.24%, weekly: 1.71%/-2.8%
The monthly pivot line is at 1.302, S1 – 1.286, R1 – 1.32.
The projected trading range for GBPUSD for next week is 1.29 – 1.32
Long RR 0.42, Short RR 2.41
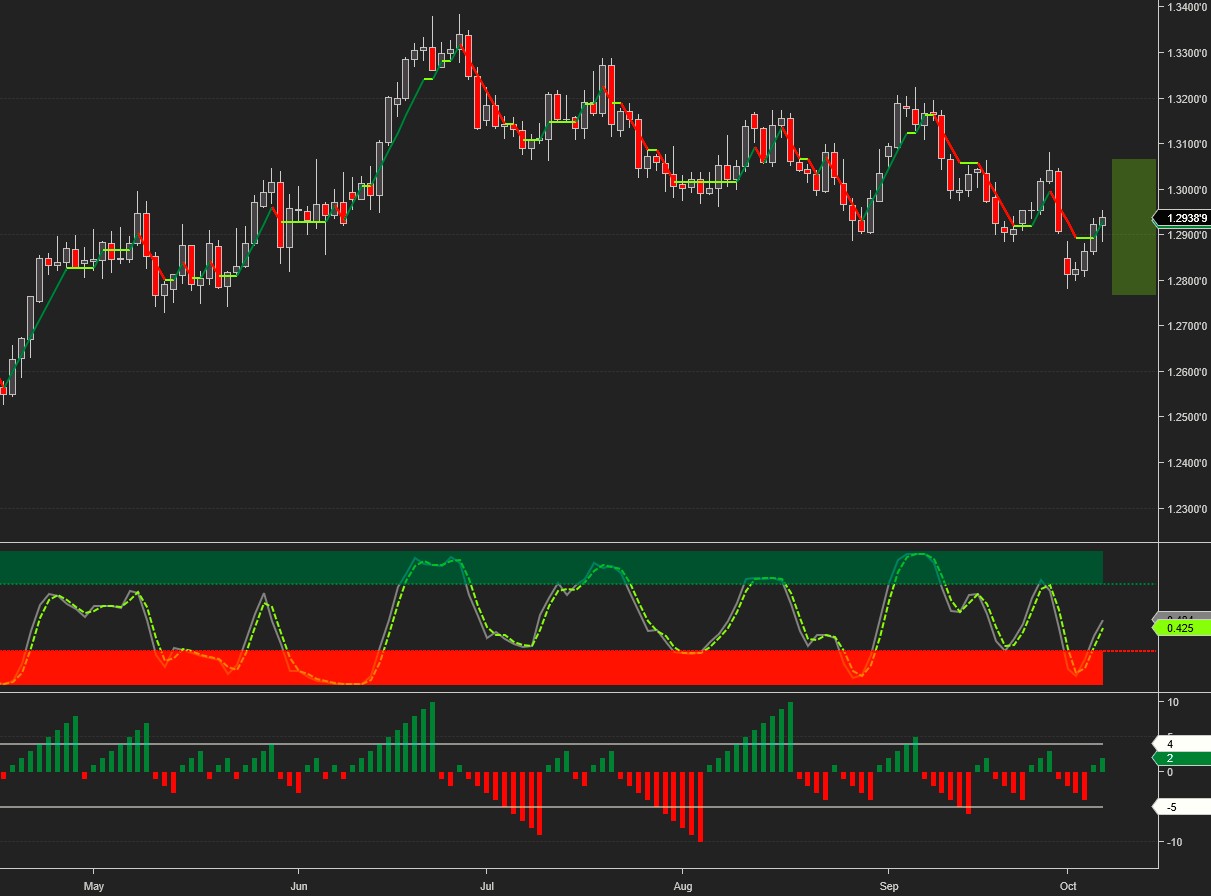
USDCAD reached the downside target on Monday and has been rebounding ever since.
Current SAR signals: Daily Buy, Weekly Sell/Hold
Average up/down swing duration daily: 4/5, weekly: 7/5
Average up/down swing gain/loss daily: 1.03%/-.9%, weekly: 2.95%/-2.34%
Monthly pivot at 1.284, S1 – 1.27, R1 – 1.3
The projected trading range for USDCAD for next week is 1.277 – 1.307
Long RR 0.78, Short RR 1.29
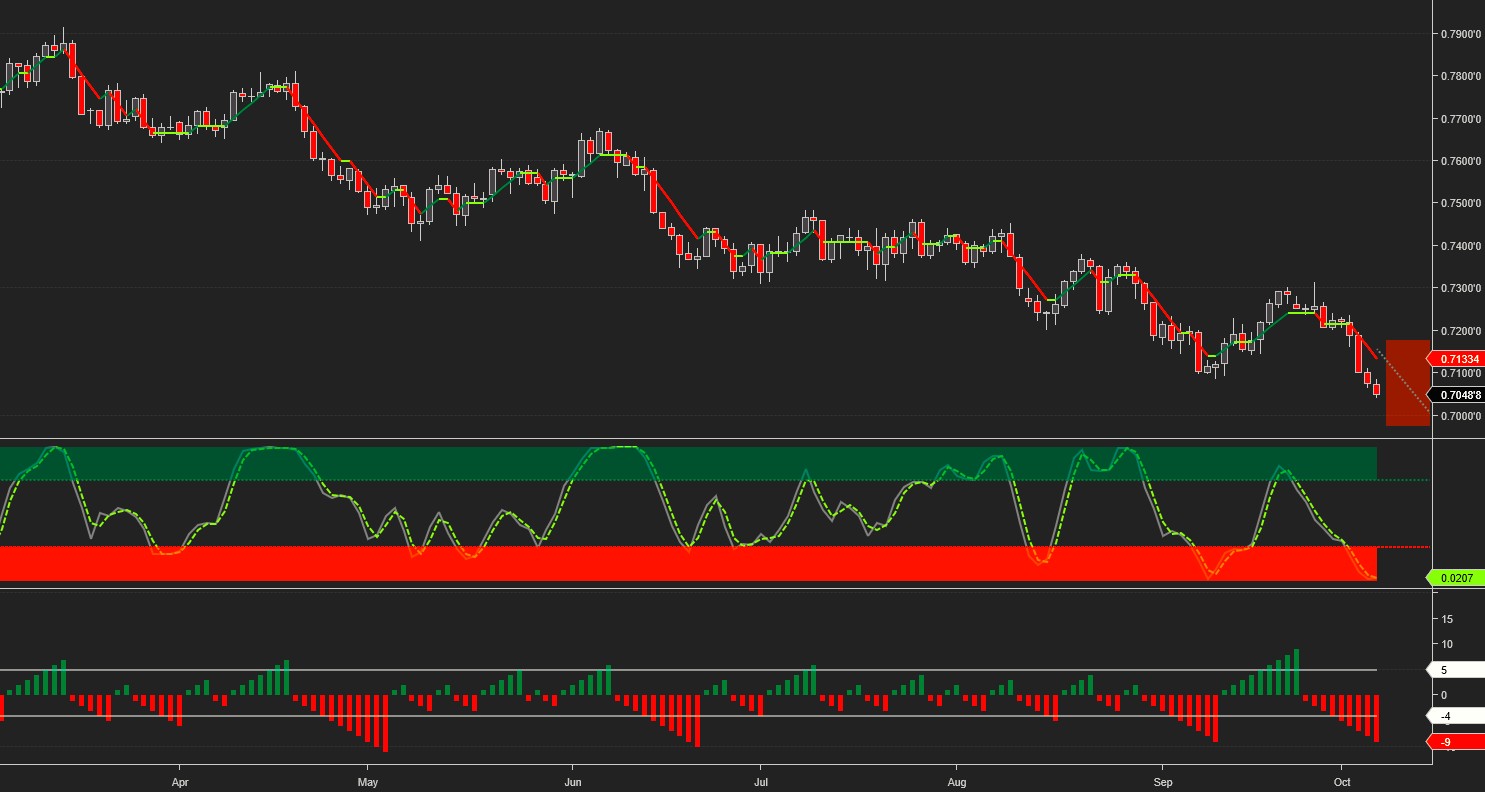
AUDUSD reached the weekly downside target on Wednesday and continued lower towards the monthly target.
Current trading signals: Daily Sell, Weekly Sell
Average up/down swing duration daily: 5/4, weekly: 5/4
Average up/down swing gain/loss daily: 1.2%/-1.2%, weekly: 2.56%/-2.71%
Monthly pivot line at 0.722, S2 – 0.702, R1 – 0.733
The projected trading range for AUDUSD for next week is 0.697 – 0.718
Long RR 1.69, Short RR 0.59
Charts, signals and data courtesy of OddsTrader, Gann 9, CIT for TradingView and NinjaTrader 8
For intraday charts and updates follow us on TradingView
Disclaimer:Futures and forex trading contains substantial risk and is not for every investor. An investor could potentially lose all or more than the initial investment. Risk capital is money that ...
more

