
Gold Forms A Doji Below 1200
Daily Forex Market Preview, 2/10/2016
The US Dollar remained weak yesterday despite the lack of any market events. EUR/USD was seen trading near 1.13 while Gold attempted another go at the $1200 handle but failed. The economic calendar is busy today with the UK manufacturing and industrial production numbers due during the European session while Janet Yellen’s semi-annual testimony is due later in the evening.
EUR/USD Daily Analysis
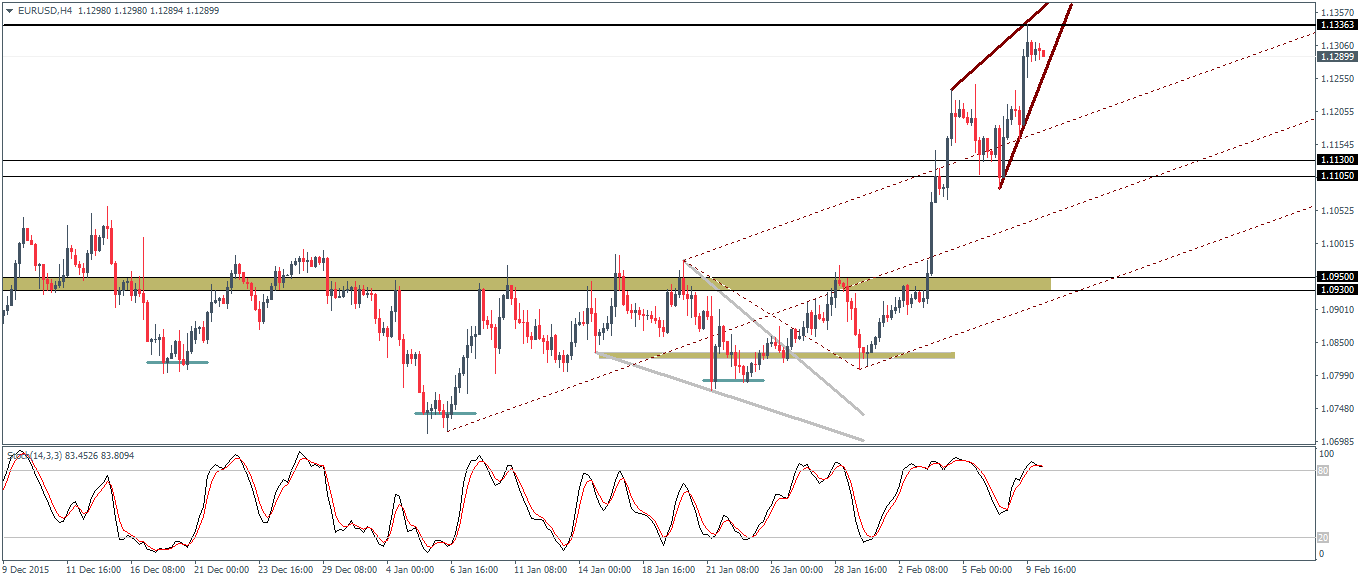
EUR/USD (1.12): EUR/USD was seen briefly trading near 1.130 yesterday after prices rallied strongly during the NY trading session. Despite the rally, the resistance zone near 1.13 - 1.12 should be able to contain the rally for the moment, with a pullback likely to see a decline back to 1.11 - 1.113 where an initial support looks to have formed. There is also a strong bearish divergence that is still in play with prices expected to decline back to 1.095 - 1.0 9 level where support needs to be established in order to make further rallies more meaningful. The 4-hour chart shows a rising wedge being formed at the top of the rally and a breakout from this rising wedge could signal a move to the downside. However, if prices break above 1.1336, further upside in EUR/USD cannot be ruled out.
USD/JPY Daily Analysis
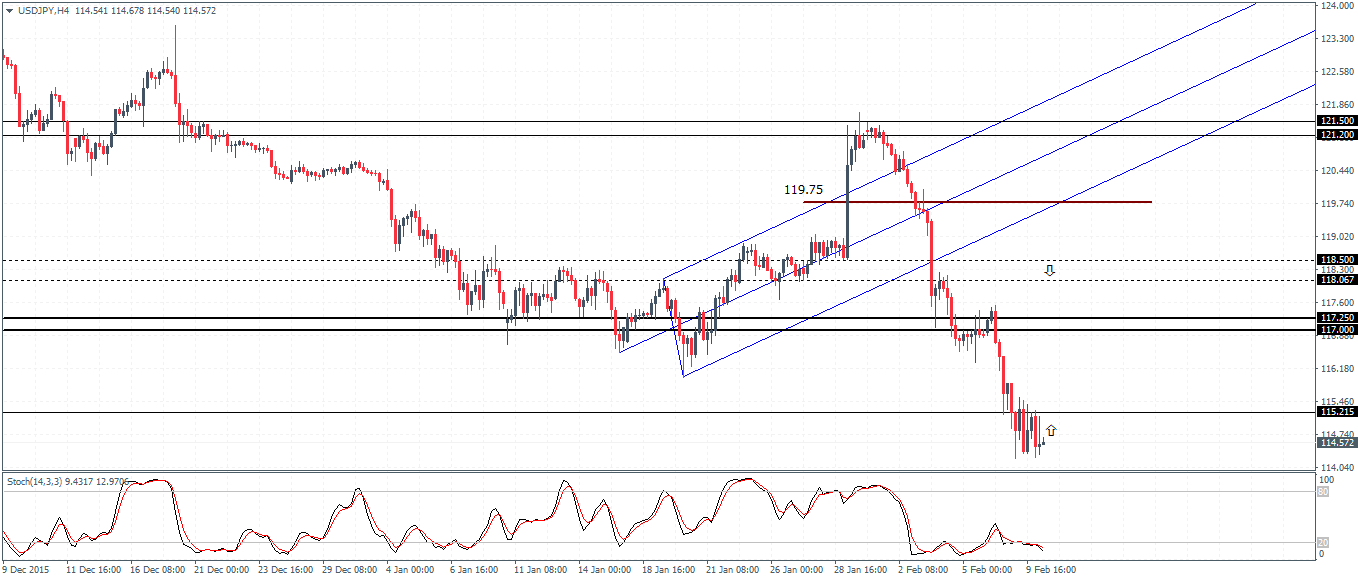
USD/JPY (114.6): USD/JPY is now trading at 114.6 after breaking below the 115 barrier. Resistance is seen at 117.065 - 116.2 region and a pullback here is expected ahead of further declines. Only a close above 117 will mark a move towards 118.4 level of next resistance. On the 4-hour chart, USD/JPY is showing strong consolidation within the 115.2 - 114.3 levels, which could indicate a potential breakout in the near term with a pullback likely to initially stall near 117.25 - 117.0 while the 4-hour Stochastics divergence points to 119.75 as the level prices could correct too.
GBP/USD Daily Analysis
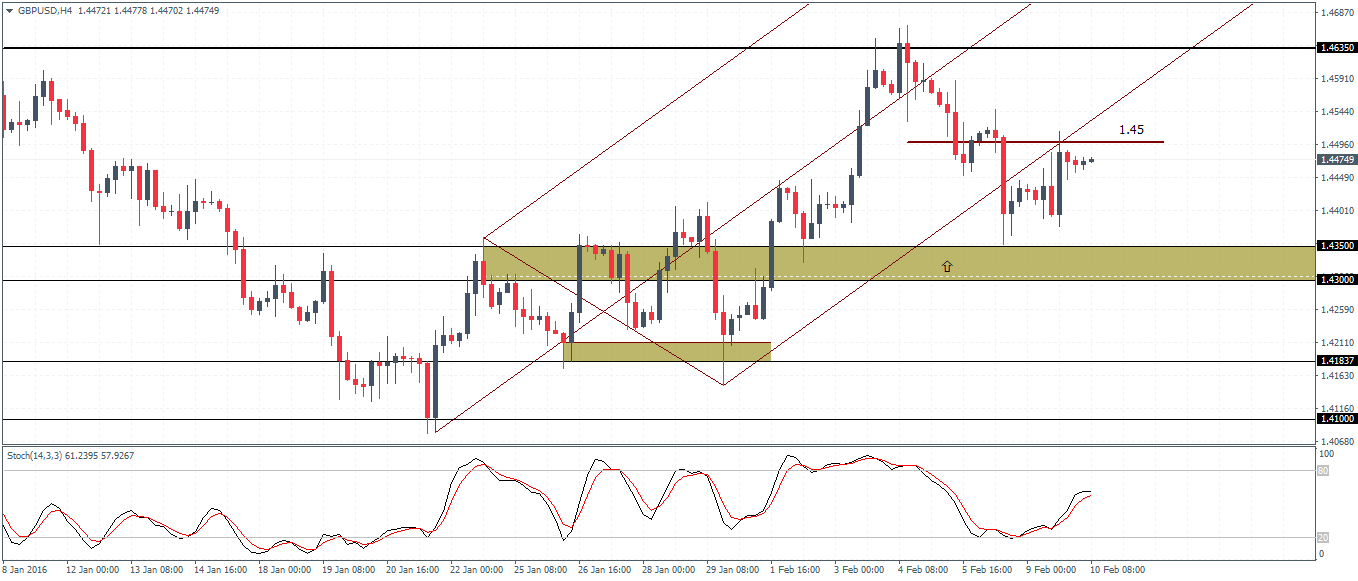
GBP/USD (1.44): Prices bounced off the 1.443 support yesterday and price action is likely to range from 1.443 - 1.463 levels for the near term. To the downside, the support at 1.435 - 1.40 was barely tested and exposes a potential risk for a move to the downside. 1.45 is the main resistance level on the short term chart and as long as GBP/USD is capped below this resistance, a decline to 1.43 cannot be ruled out. Above 1.45, GBP/USD could rally to retest the previous highs near 1.4635.
Gold Daily Analysis
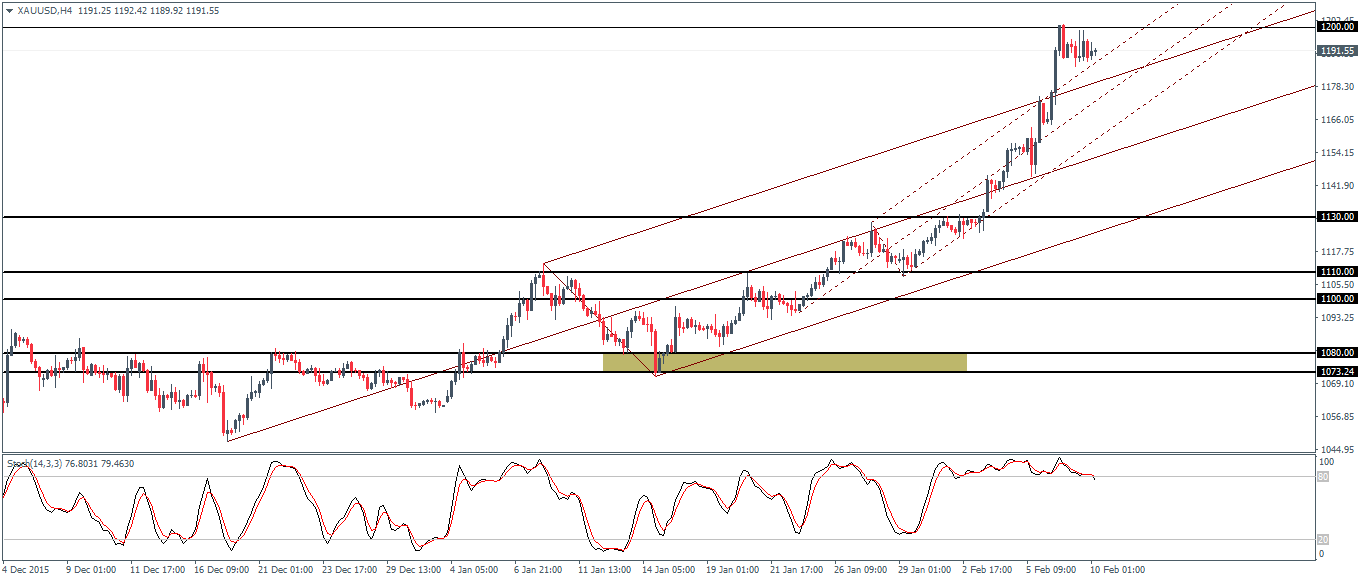
XAU/USD (1191): Gold prices attempted to test the 1200 handle yesterday but yet again failed to close above this level. Price action has closed in a doji candlestick pattern yesterday which marks a potential indecision. A close below the doji low at 1189.10 will signal a move to the downside with 1130 coming in as the initial support. Below 1130, further declines could see Gold decline to 1110 - 1100 levels to establish support. The bias remains to the upside in Gold as long as prices remain above the 1100 handle.
Disclaimer: Orbex LIMITED is a fully licensed and Regulated Cyprus Investment Firm (CIF) governed and supervised by the Cyprus Securities and Exchange Commission ...
more


As global markets seem to be falling apart everywhere we look, it seems that Gold is one of the only few rays of light out there. This as investors seek the "perceived" security of precious metals. And news just in that as of a few hours ago, gold hit $1260 for the first time in years. Gold prices are still down around 34% from their peak of $1,800 in 2011. Of course, don't jump on the gold bandwagon too fast because this all could come to a grinding halt if the Fed raises interest rates, then you'll see everyone abandoning gold as prices drop and the dollar shoots up. Welcome to the seesaw market of 2016!
Agreed.