
Some Daily Charts
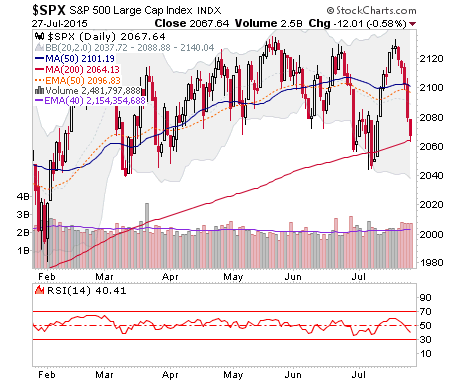
SPX is at its MA 200. Time to bounce to keep this unpleasant chart from becoming ugly like the Dow.
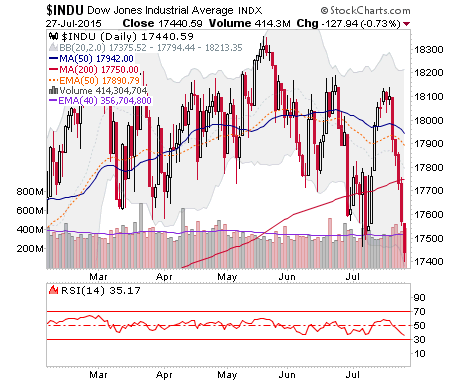
Dow is around a short-term trend line but below lateral support. It can bounce but this has technical damage.
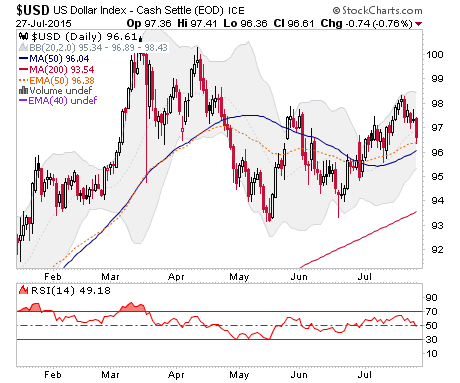
Uncle Buck was down yesterday as well as the Euro popped (short covering?). Unc needs to make a higher low to June (after tickling a higher high to May) to stay bullish.
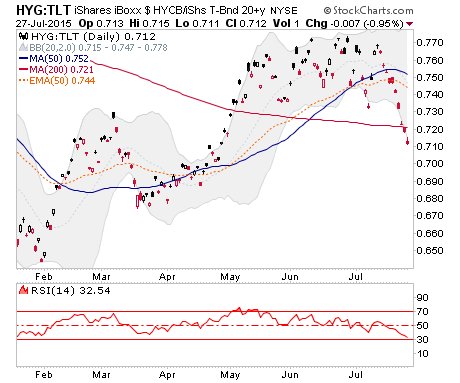
Junk to Treasury: Risk ‘off’, obviously.
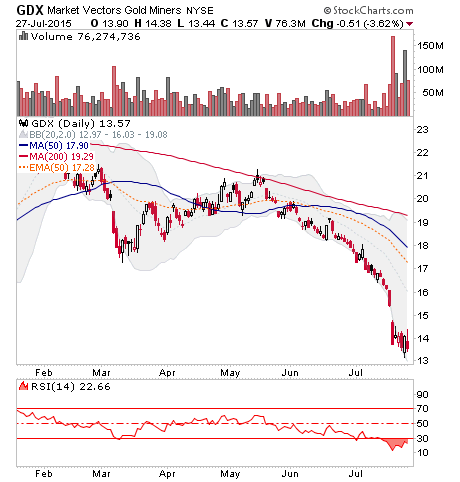
This should stir up yet more hatred of the miners. GDX could not even get a 2 day thing going. But that over sold reading probably needs to be ameliorated. Last week’s volume meant something, didn’t it?
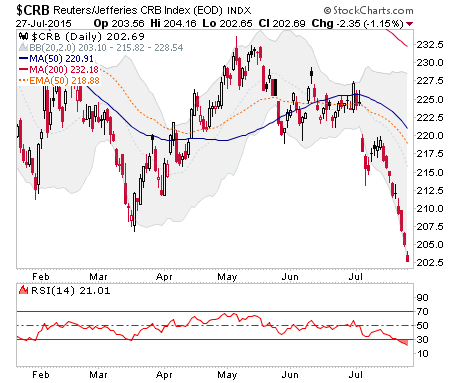
Some are talking about a generational ‘buy’ in commodities, but I cannot square that with my views of an ‘as good as it’s gonna get’ economy. I could be wrong, but then again I am not your standard inflationist. This over sold stuff can sure bounce at some point though.
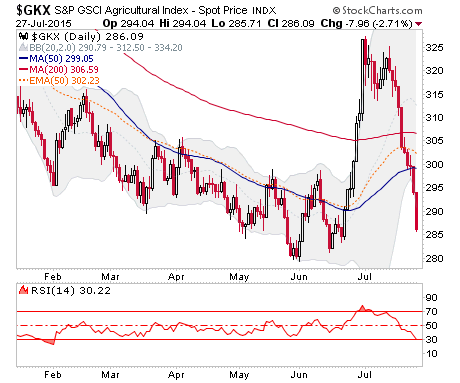
Why, just look at the Ag’s. A bounce and a half and then total implosion of said bounce. I personally do not have the stomach for this rolling commodity speculation stuff.
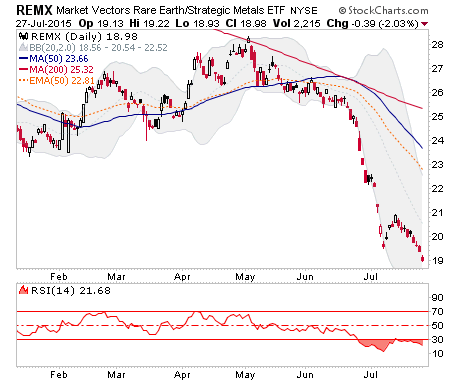
REE’s… where are the pumpers now?
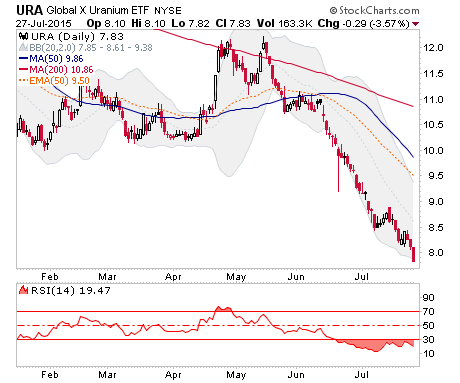
Uraniums… where are the pumpers now?
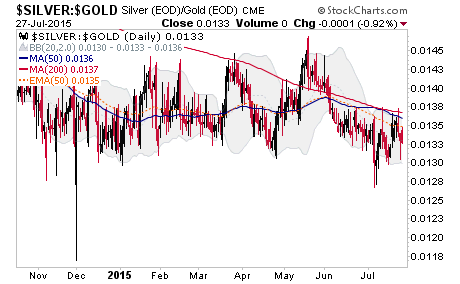
When silver bounces vs. gold, commodities will have a chance to do the same. But Silver-Gold is not only bearish by this daily chart, it’s very bearish by a weekly chart that I am sure you’ll see pop up here again sooner or later.
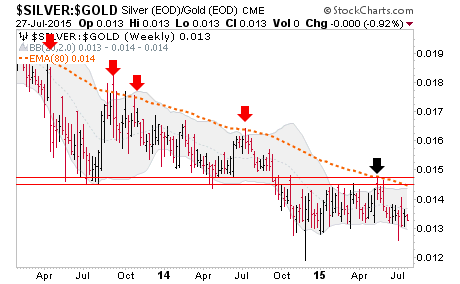
Heck, let’s break the daily theme and pop in the weekly. Silver is in lock down vs. gold on a longer-term perspective and that ain’t good for the ‘inflation trade’.
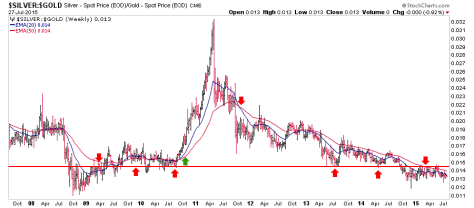
This chart shows just how long a term we are talking…
Disclosure: Subscribe to more


