
GBP/USD Weekly Analysis – Sunday, October 15
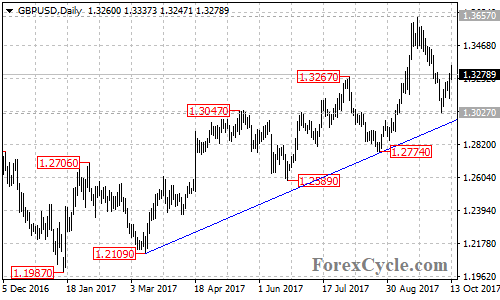
GBP/USD failed in its attempt to break below the bullish trend line on the daily chart and rebounded from 1.3027, indicating that the pair remains in the uptrend from 1.1987. A further rise towards the bearish trend line on its weekly chart is possible next week, a breakout of this trend line could signal resumption of the uptrend, then next target would be at 1.3950 area.
On the downside, a breakdown below the bullish trend line on the daily chart will confirm that the uptrend had completed at 1.3657 already, then the following downside movement could bring price back towards 1.1946 (Oct 2016 low).
How did you like this article? Let us know so we can better customize your reading experience.

Comments
Leave a comment to automatically be entered into
our contest to win a free Echo Show.

