
GBP/USD Weekly Analysis – September 24
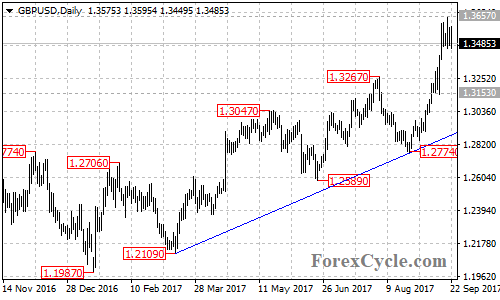
GBP/USD is now facing a long term bearish trend line on its weekly chart. An upside break through the trend line could take price to next resistance level at 1.3950 which would be the final target of the uptrend from 1.1946 (Oct 2016 low). Near term support is at 1.3360, followed by 1.3153, below these levels could bring price back towards the rising trend line on the daily chart. Only a clear break below this trend line support could signal completion of the uptrend.
How did you like this article? Let us know so we can better customize your reading experience.

Comments
Leave a comment to automatically be entered into
our contest to win a free Echo Show.

