
GBP/USD: Pound Pops As The BoE Goes Hawkish; Look To The Crosses
BOE GOES HAWKISH AT SUPER THURSDAY
At this morning’s Bank of England Super Thursday event, many were looking for the bank to begin moving to a more hawkish stance as rising inflation in the UK continues well-above the bank’s 2% target. And while the BoE would likely want to take a passive approach, instead hoping that the recent strength in the currency helps to soften those rising prices, there’s little evidence of inflation slowing down and this will likely compel them into action later this year.
This showed up this morning when the BoE shifted expectations towards two rate hikes this year from the previous expectation of one. The bank also increased both inflation expectations and growth forecasts for the coming periods; all-in-all producing a fairly hawkish outlook at this morning’s rate decision. This equated to a near-immediate pop in the Pound as the currency surged off of the confluent support zone that we looked at yesterday. Prices rose to the vaulted psychological level of 1.4000, at which point a bit of resistance started to show before bulls were able to nudge prices-above.
GBP/USD 15-MINUTE CHART: JUMP FROM CONFLUENT SUPPORT, ABOVE 1.4000
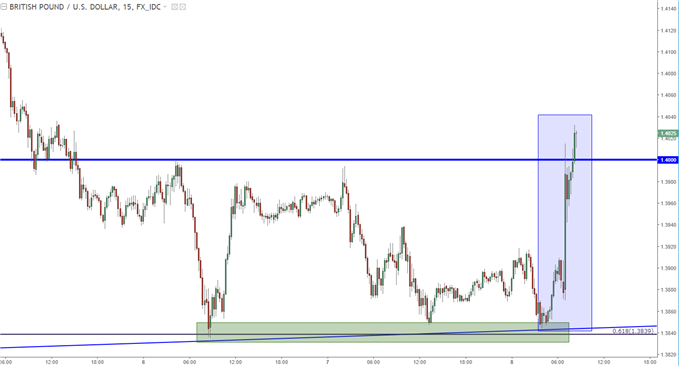
Chart prepared by James Stanley
CAN THE GBP/USD BREAKOUT SUSTAIN?
The big question at this point around Cable is whether strength can continue, and the answer to that question will likely be determined by whether this recent strength in the US Dollar can hold or whether it flares out as most USD-strength scenarios over the past year have. We looked at the US Dollar attempting to breakout from the 90.00 level on DXY yesterday, which happened shortly after we published. But that strength really didn’t slow down around resistance, as the breakout continued to run until prices in DXY had moved up to 90.40. With DXY now pulling back, the big question here is whether we see support show up at old resistance for the topside move to continue.
US DOLLAR VIA ‘DXY’ BREAKOUT OVER 90.00: WILL OLD RESISTANCE SHOW NEW SUPPORT?
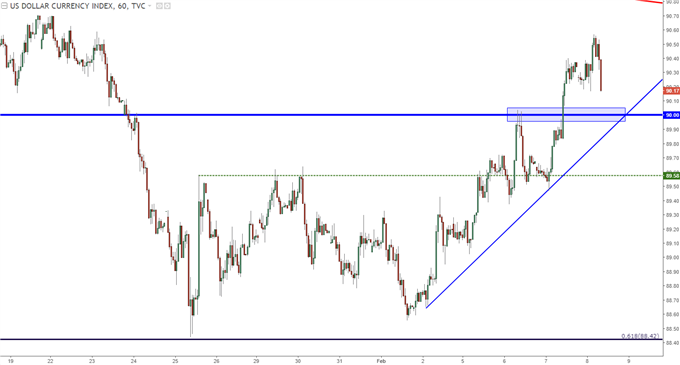
Chart prepared by James Stanley
CABLE SUSTAINING ABOVE 1.4000 IS KEY FOR LONGER-TERM APPROACHES
On longer-term charts of Cable, sustaining a break above that 1.4000 level will be key for bullish continuation plays. We wrote about the confluent support that was showing in GBP/USD ahead of this morning’s rate decision, and this comes in around a key Fibonacci level as well as a channel mid-line from the 2017 bullish trend. This can keep the door open to bullish strategies, but the fact that buyers have thus far been unable to support a move back above 1.4000 is troubling, as the pair may still be a bit overbought on a bigger picture basis. While this morning’s move is attractive, it’s also pushed prices far away from nearby support, making the prospect of chasing the move at this point utterly unattractive.
GBP/USD DAILY CHART: BOUNCE FROM FIBONACCI, MID-LINE SUPPORT
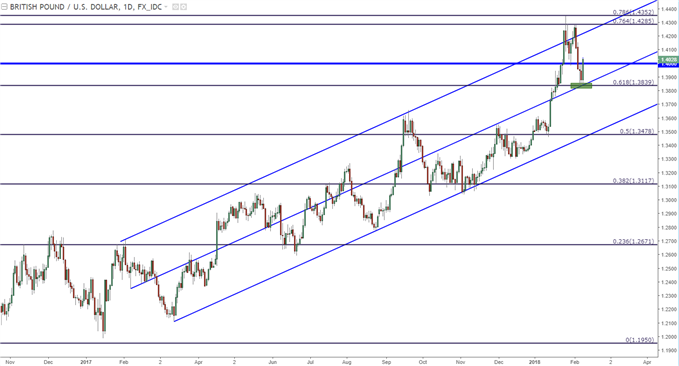
Chart prepared by James Stanley
FOR GBP-STRENGTH STRATEGIES, LOOK TO THE CROSSES
Given the events of the past couple of weeks for those looking at GBP-strength plays, pairing the Pound with a currency that is not the US Dollar could be a bit more attractive than running such a strategy through Cable. While that longer-term downtrend in the Dollar still hasn’t died, the currency has become quite oversold in the past year and this recent show of strength may be precluding a bigger picture bullish move.
GBP/AUD and GBP/NZD could be attractive for GBP-strength scenarios given recent moves. Last week brought an RBA rate decision and last night brought the RBNZ. Neither Central Bank is looking at hiking rates anytime soon nor this does this seem to be an intermediate-term concern. Correspondingly, both currencies have been showing varying degrees of weakness, and this could make for a more attractive scenario if looking for GBP strength.
GBP/NZD was our ‘trade of the year’ (request ‘top trading opportunities in 2018 as part of our Trading Guides) under the premise that we’d see the Bank of England grow more hawkish while the RBNZ tried to avoid the topic of higher rates altogether. That’s largely happened this year, and the pair is currently approaching fresh 2018 highs after starting the year on the wrong foot.
The pair is currently up over 400 pips in the past two trading days after the one-two combo of the RBNZ last night and the BoE this morning.
GBP/NZD HOURLY: BULLISH BREAKOUT AFTER RBNZ, BOE
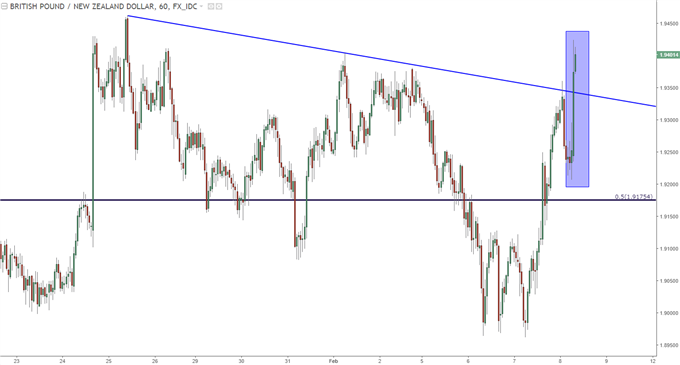
Chart prepared by James Stanley
BULLISH PROSPECTS IN USD?
Mentioned above was the complication of bullish scenarios in Cable at the moment, and this would largely be taken from the fact that the US Dollar is in the midst of a bullish breakout that, as yet, has shown no sign of stopping. We looked at a huge support level in DXY a couple of weeks ago and since then, prices have been unable to break lower. And after spending most of last week ranging-around near the bottom of that bearish move, prices have begun to break-higher through resistance this week.
Given how oversold the Dollar was coming into this month, this is a move that could continue as shorts get squeezed. This could equate to pressure in those well-built trends in EUR/USD and GBP/USD. But, while this shift to Dollar strength has been taking place, something else has been going on, and that’s been weakness in Australian and New Zealand Dollars and each of these currencies could be attractive for trading USD-strength scenarios.
In AUD/USD, prices have been on direct retreat since setting a fresh two year high in January. That high just barely squeaked above the prior high, at which point sellers took over in-droves to heavily reverse the move. It’s been largely a one-way ticket since then, and near-term price action has already moved into an oversold state. Below are a series of resistance levels that could be attractive for short-side AUD/USD continuation.
AUD/USD FOUR-HOUR CHART
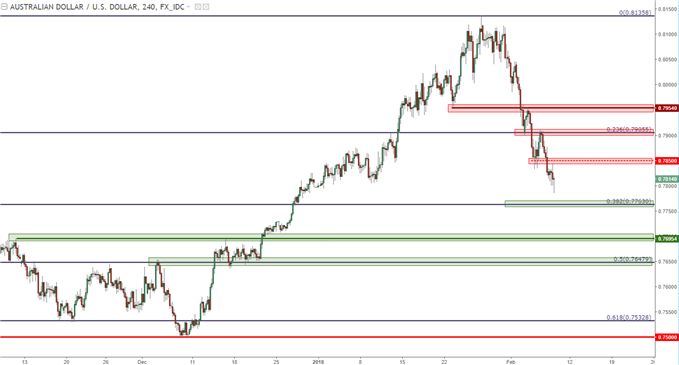
Chart prepared by James Stanley
NZD/USD FALLS FROM RANGE RESISTANCE AFTER RBNZ
Last night brought a rate decision out of the RBNZ, and NZD/USD is coming off of a big level in response. By and large, NZD/USD has been range-bound for the past year-plus. The Fibonacci level at .7335 has helped to define resistance, and we caught another instance of that yesterday ahead of the RBNZ rate decision. Prices have started to drop, opening the possibility of USD-strength helping this longer-term range to fill in to the short-side. The weekly chart of NZD/USD is below:
NZD/USD WEEKLY CHART: FALLING FROM LONG-TERM RANGE, FIBONACCI RESISTANCE
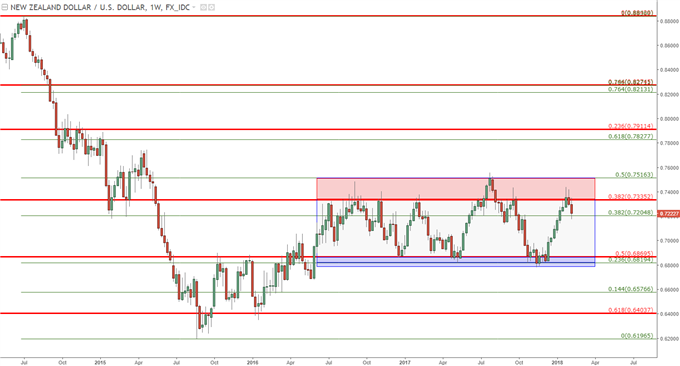
Chart prepared by James Stanley


