
GBP/USD Daily Analysis – Wednesday, October 18
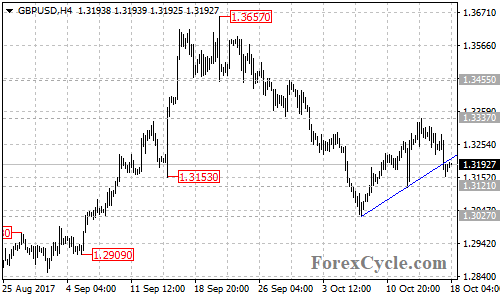
GBP/USD broke below the rising trend line on its 4-hour chart, indicating that the short term uptrend from 1.3027 had completed at 1.3337 already. Deeper decline would likely be seen and next target would be at 1.3121.
Below this level could trigger further bearish movement towards the bullish trend line on the daily chart. Near term resistance is at 1.3230, only break above this level could bring price back to test 1.3337 resistance. Above this level could signal resumption of the uptrend from 1.3027, then the following bullish move could take price to next resistance level at 1.3455.
How did you like this article? Let us know so we can better customize your reading experience.

Comments
Leave a comment to automatically be entered into
our contest to win a free Echo Show.

