
GBP/USD Builds Triangle But USD/JPY Keeps Momentum
EUR/USD
4 hour

The EUR/USD showed a bearish bounce at resistance (red) within a bigger consolidation zone (red/green lines). Price has now reached the bottom of that zone (green) and a bearish break could indicate a fall within a wave Y (purple) of wave d (green).
1 hour
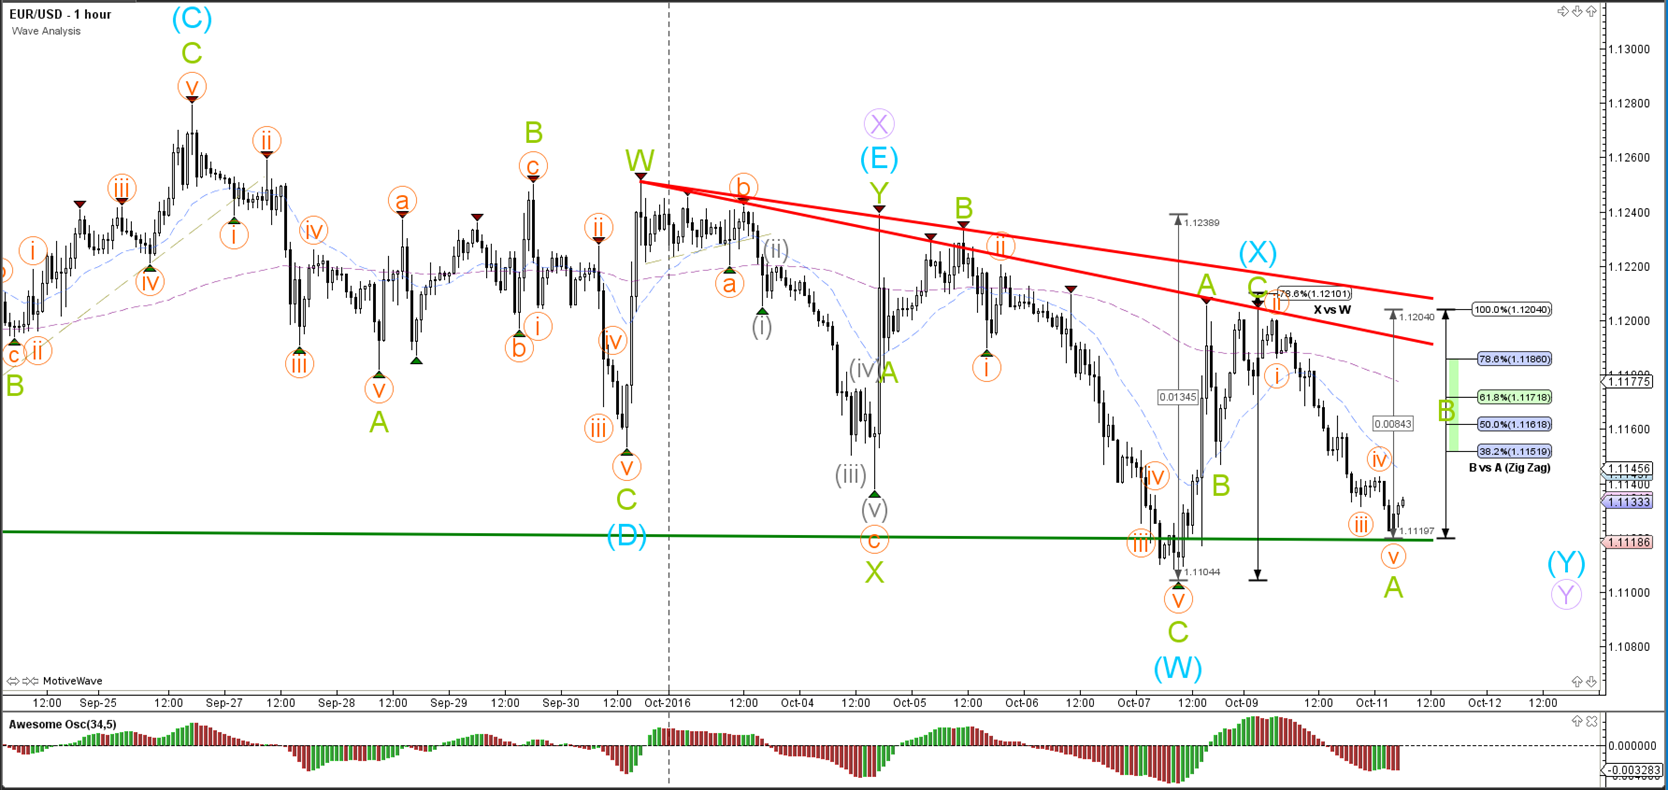
The EUR/USD built a bearish 5 wave which has been marked a wave A (green). A break above the 100% Fibonacci level invalidates wave B (green).
GBP/USD
4 hour

The GBP/USD decline completed a wave 3 (green) and is expected to respect the Fibonacci levels of wave 4 vs 3 within the wave 4 (green) correction.
1 hour
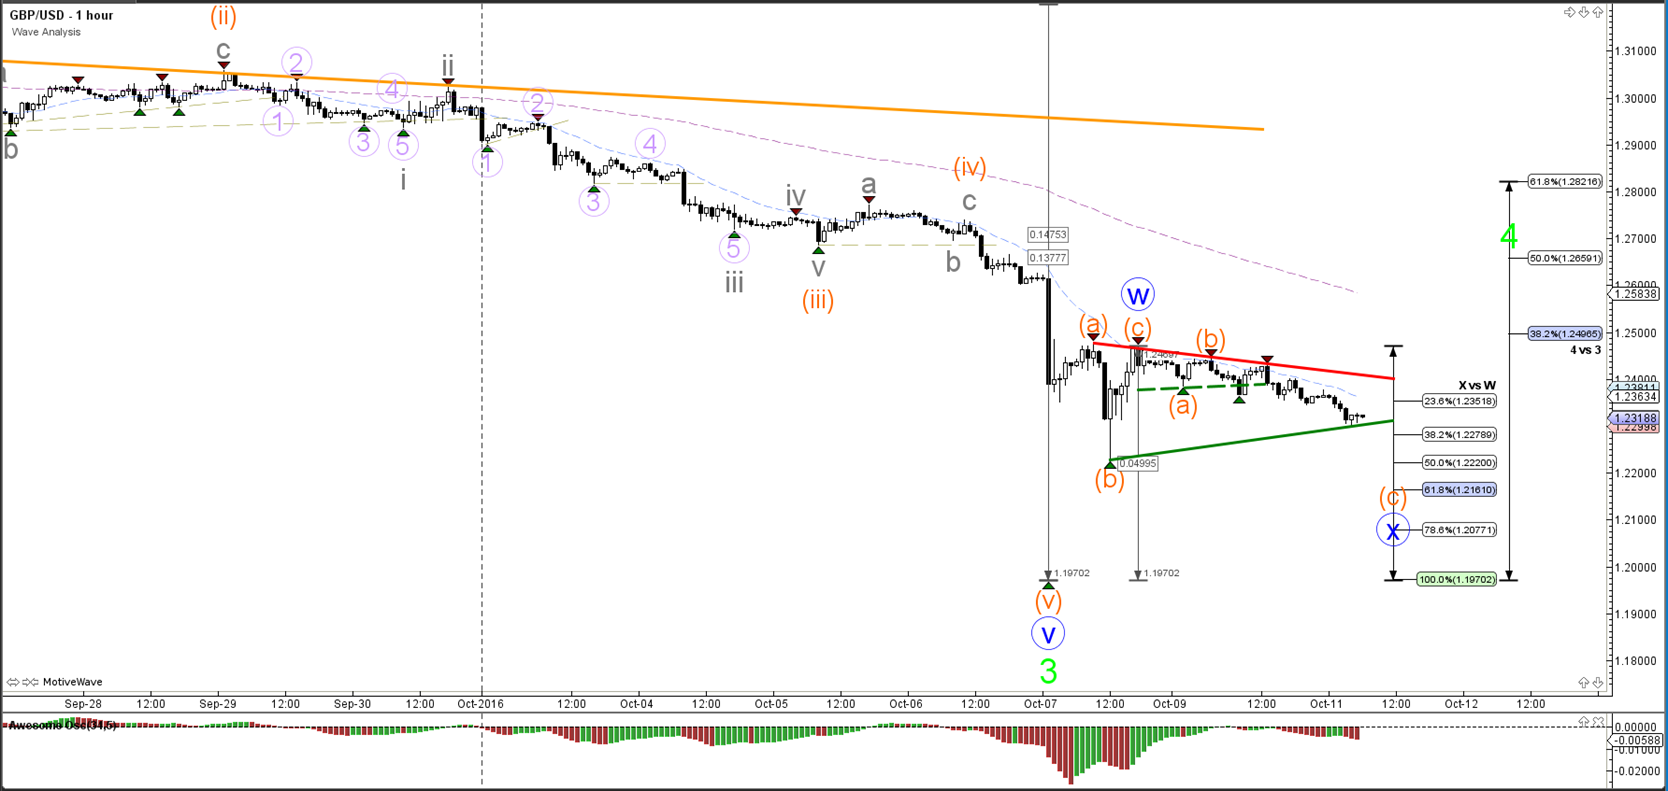
The GBP/USD has been moving up and down in a choppy and corrective manner as expected in the previous wave analysis. Price could break the trend lines but the Fibonacci levels could react as support or resistance.
USD/JPY
4 hour
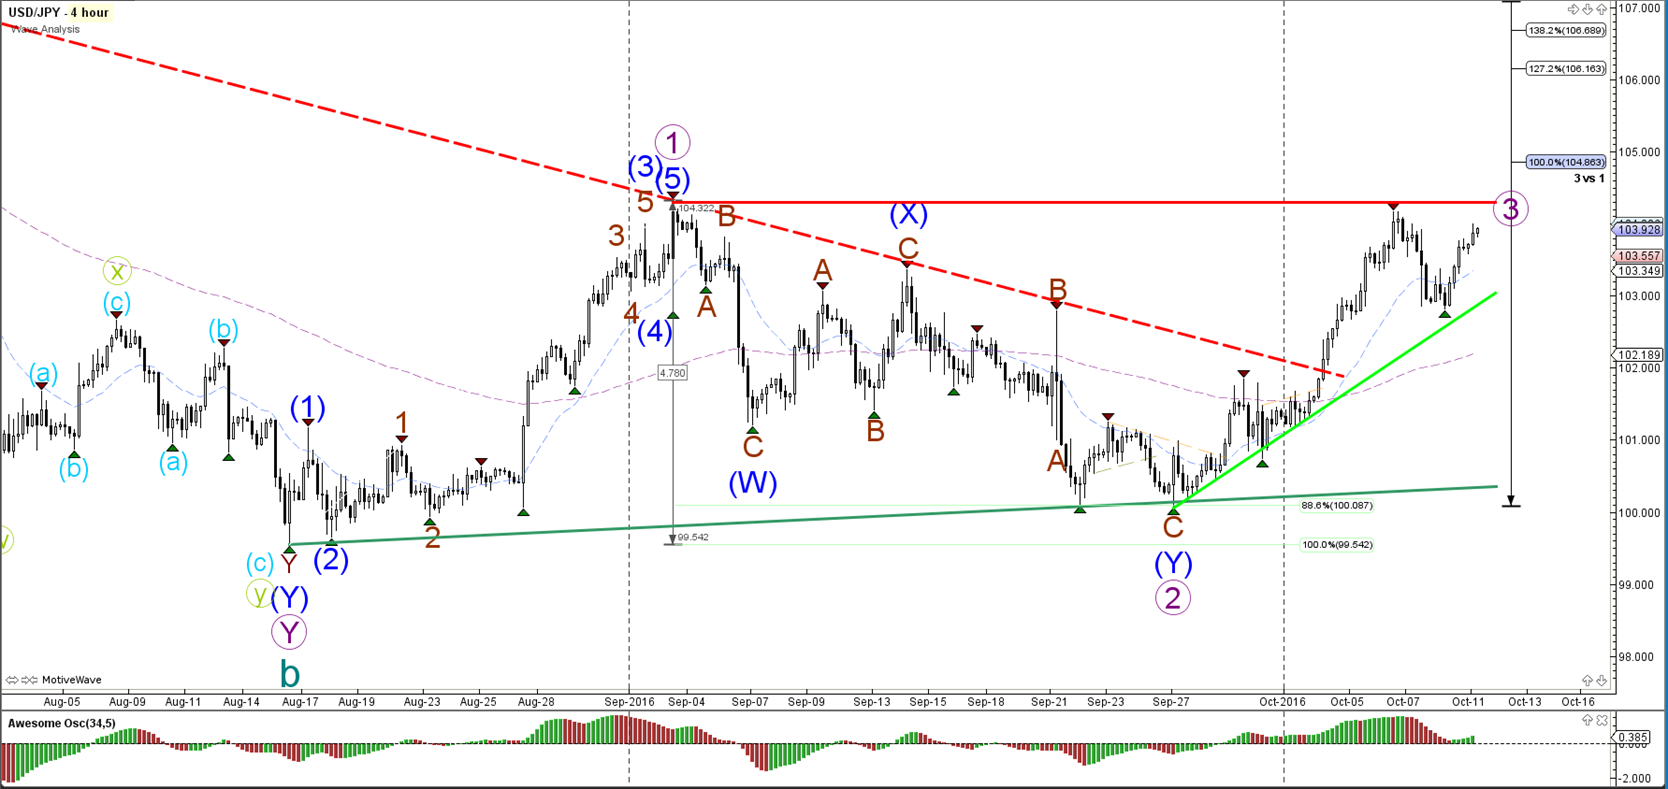
The USD/JPY broke above the resistance of the daily downtrend channel (dotted red) but price still needs to break above the horizontal resistance of wave 1 (purple) before a higher high is confirmed. Once the break occurs, a bullish impulse wave seems to be developing (purple) which is most likely wave 3 (purple).
1 hour
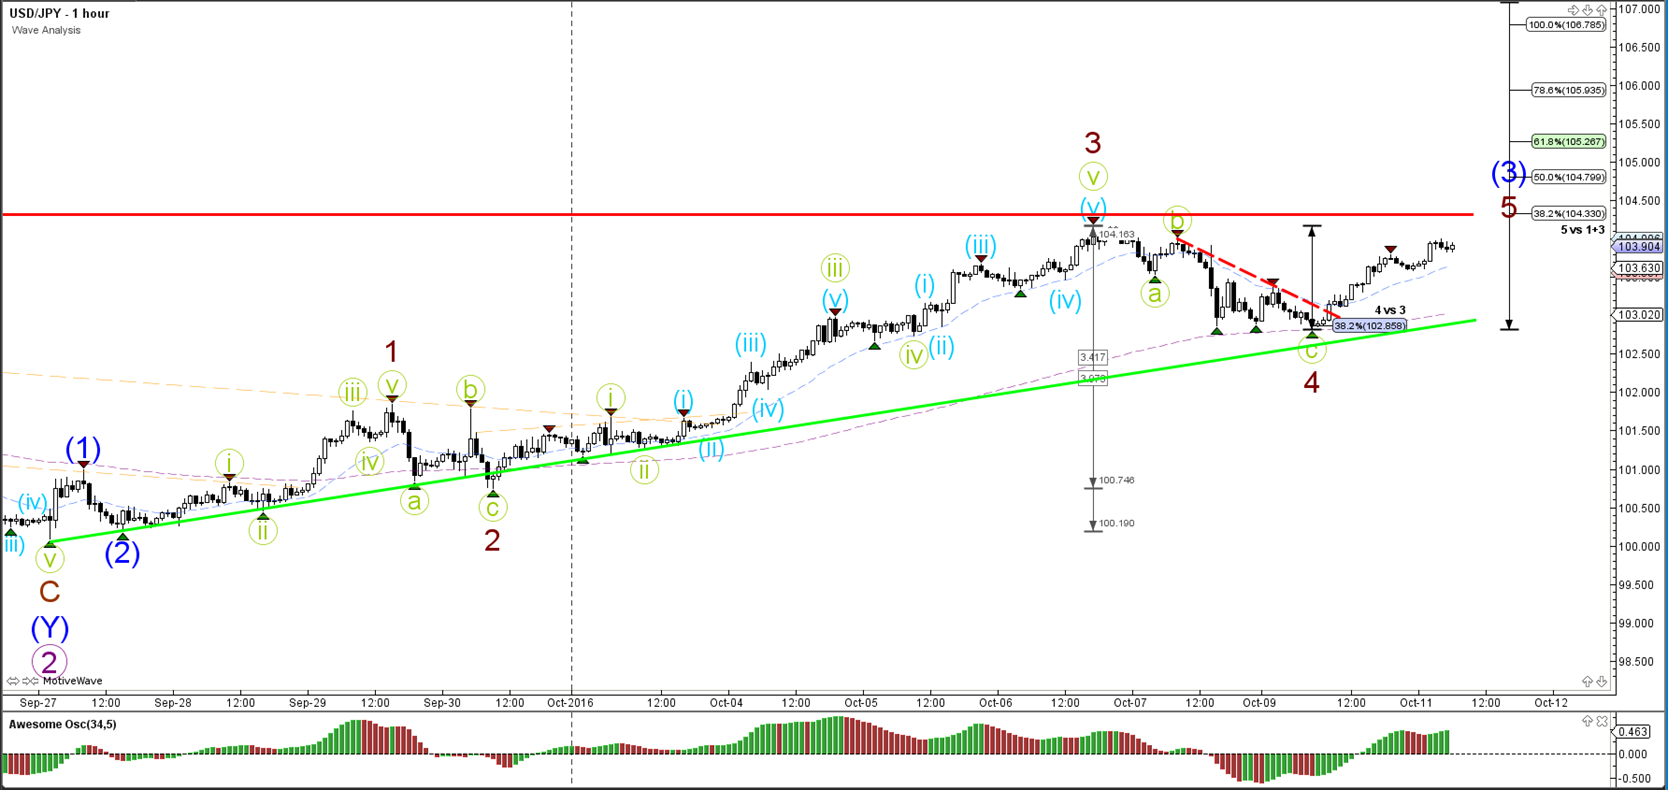
The USD/JPY turned at the 38.2% or 50% Fibonacci level (green arrows) of wave 4 (brown) as expected. The break above resistance (dotted red) has seen the USD/JPY move towards the Fibonacci targets (green arrows) but a break of the top (red) is still needed.


