
GBP/USD Builds Lengthy Triangle But USD/JPY Restarts Bullish Trend
EUR/USD
4 hour
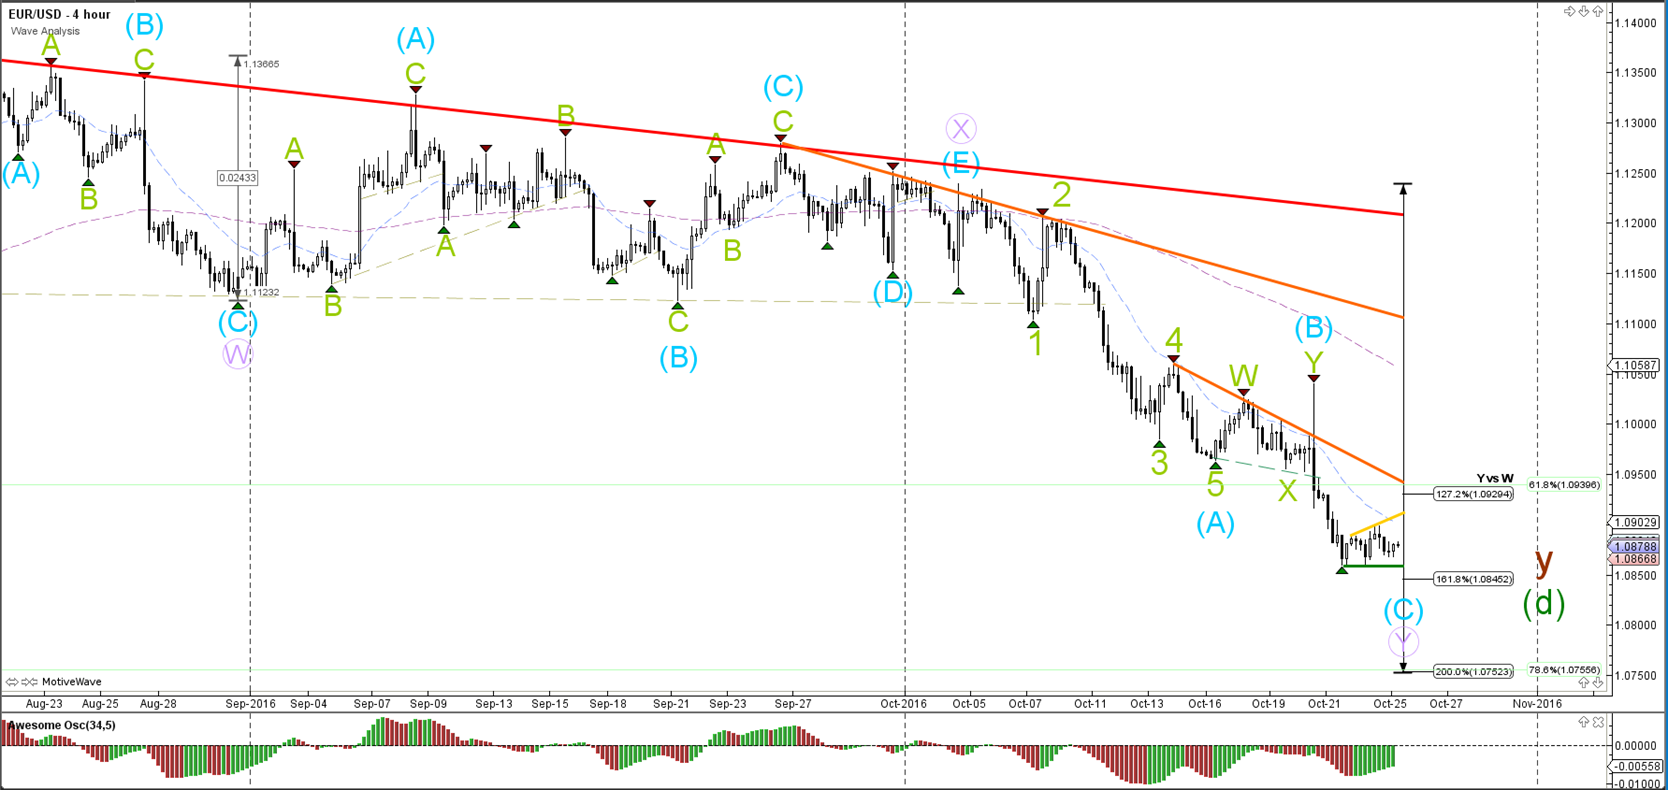
The EUR/USD is in a downtrend and building lower lows and lower highs. At the moment price is building a small sideways consolidation zone. A break below the support (green) could price fall towards 78.6% Fibonacci level of wave d (green), which is part o f a larger daily/weekly triangle (wave d green). If price manages to fall very impulsively then a larger weekly downtrend could be restarting.
1 hour
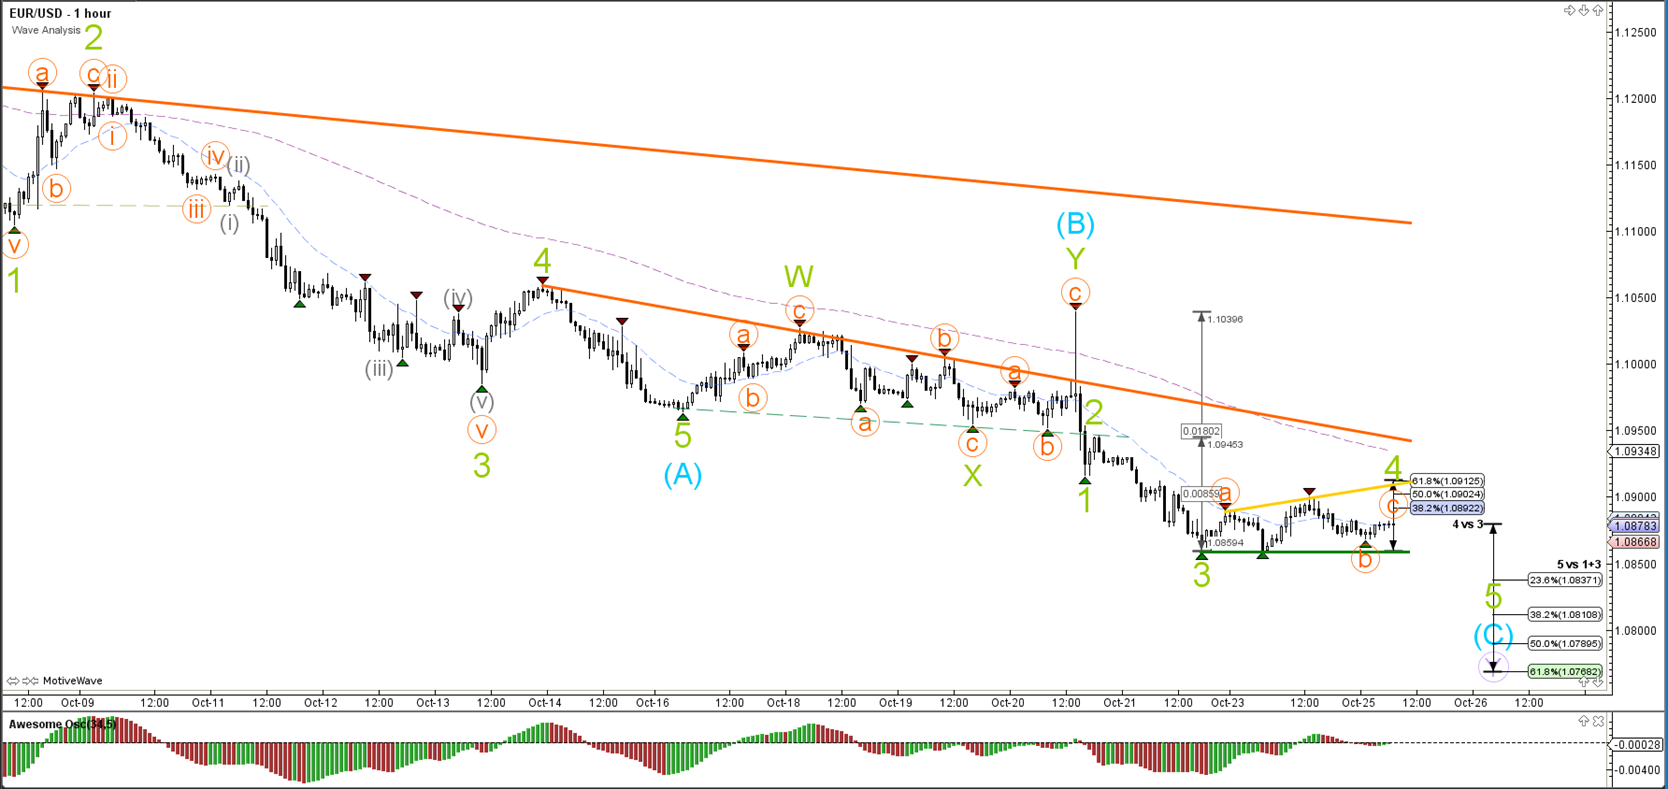
The EUR/USD is in a wave 4 (green) unless price manages to break above the 61.8% Fibonacci level of wave 4 vs 3. A break below support could see the start of wave 5 (green).
GBP/USD
4 hour
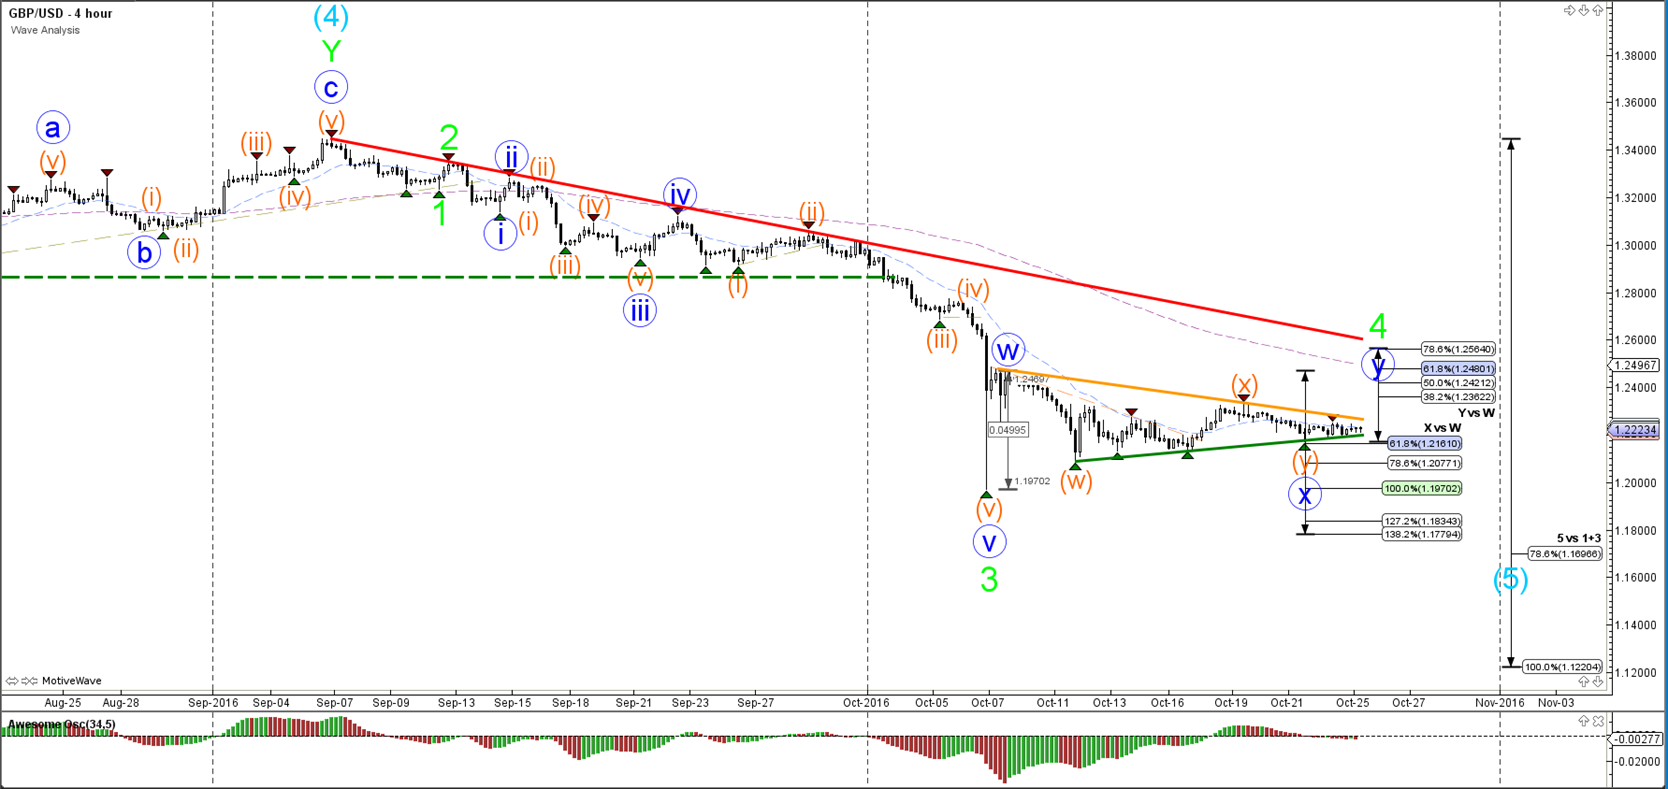
The GBP/USD is moving in between support and resistance and building a contracting triangle. The Cable is now challenging the support trend line (green). A break below it could see price develop a bearish breakout to retest the Fibonacci levels of wave X (blue). A break above resistance (orange) could see the development of a wave Y (blue) within wave 4 (green).
1 hour
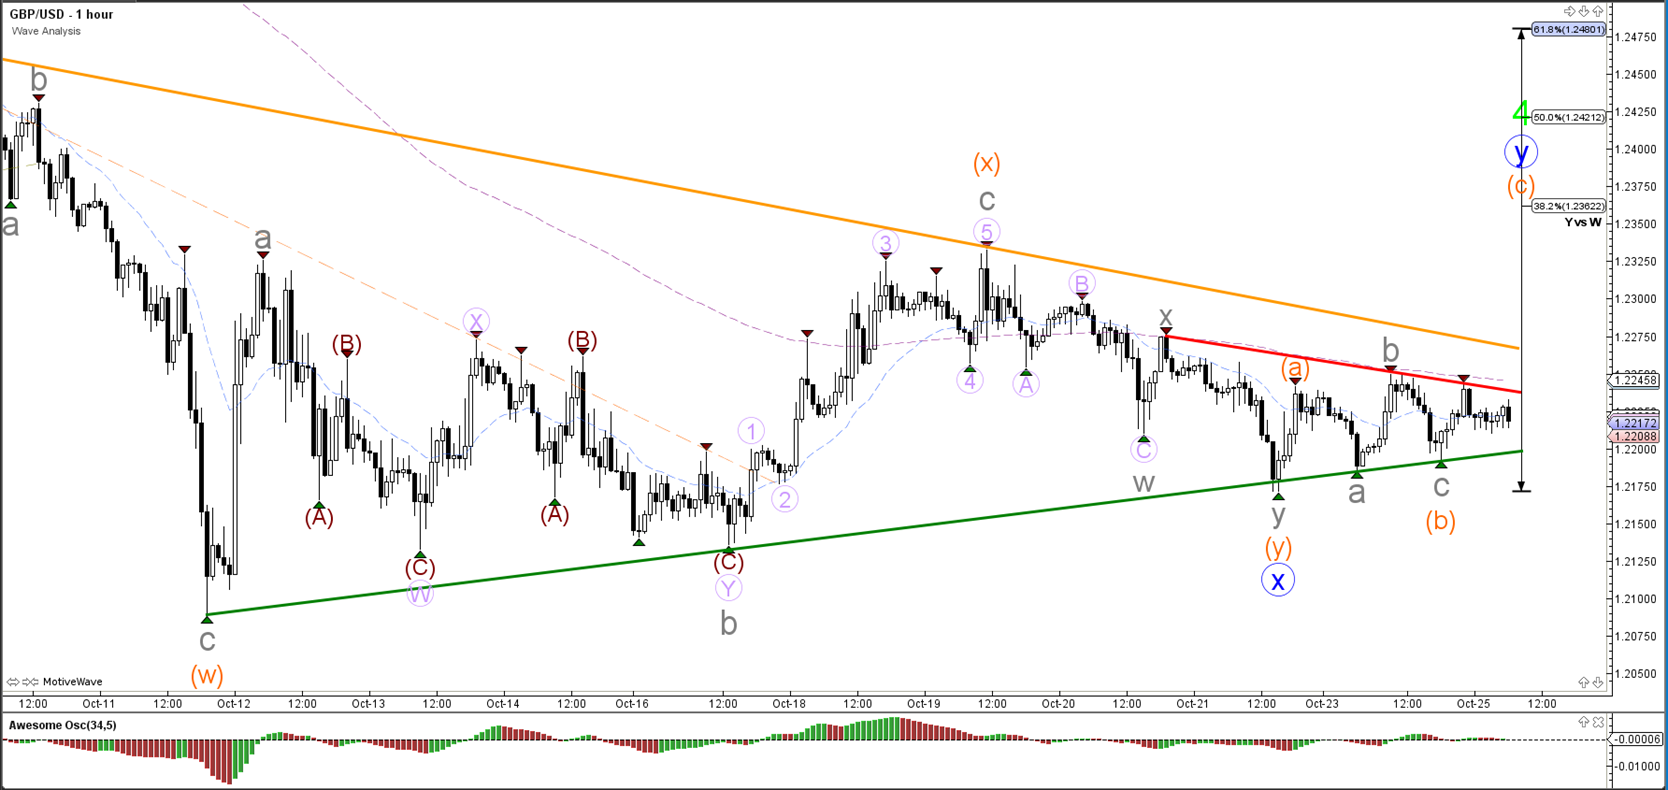
The GBP/USD is in a wedge and has support (green) and resistance (red) trend lines nearby which offer bounce and break spots.
USD/JPY
4 hour

The USD/JPY is building a sideways zone in front of the daily top (brown) but price seems to breaking above the previous wave 1 (purple), which could confirm the start of a larger uptrend (wave 3 purple).
1 hour

The USD/JPY broke above resistance (dotted red) and seems to have started wave 3 (green/brown) unless price breaks below the support trend line (green). Price is expected to build a shallow wave 4 correction once wave 3 (green) has been completed.
Trading foreign exchange or contracts for differences on margin carries a high level of risk, and may not be suitable for all investors. There is a possibility that ...
more

