
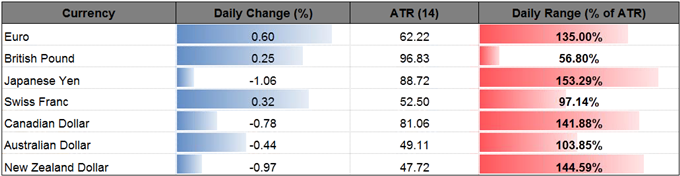
GBP/USD Breakout Capped By Near-Term Holding Pattern Ahead Of UK GDP
|
Currency |
Last |
High |
Low |
Daily Change (pip) |
Daily Range (pip) |
|
GBP/USD |
1.2828 |
1.2830 |
1.2775 |
32 |
55 |
GBP/USD Daily
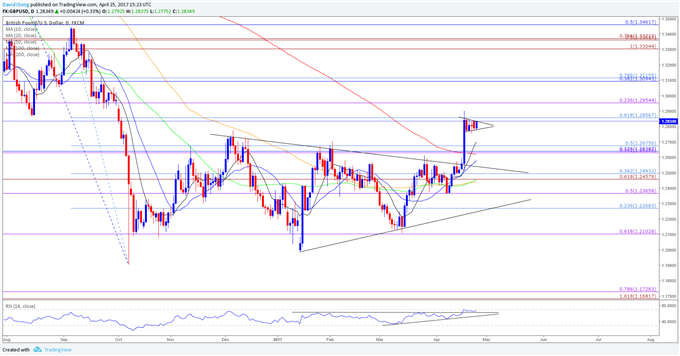
Chart - Created Using Trading View
- The near-term breakout in GBP/USD may gather pace ahead of the U.K.’s 1Q Gross Domestic Product (GDP) report as the exchange rate appears to be carving a wedge/triangle formation, with the pair approaching the apex of the continuation pattern.
- Will keep a close eye on the Relative Strength Index (RSI) as it highlights a similar dynamic and clears the bearish formation from earlier this year, but the lack of momentum to push into overbought territory may spur a pullback in the exchange rate as the pair comes up against the former-support zone around 1.2860 (61.8% retracement) to 1.2950 (23.6% expansion).
- Nevertheless, the GDP report may boosts the appeal of the British Pound as the fresh figures are anticipated to show the growth rate increasing an annualized 2.2% following the 1.9% expansion during the last three-months of 2016; a marked pickup in economic activity may alter the monetary policy outlook as it puts increased pressure on the Bank of England (BoE) to move away from its easing-cycle.
- However, Governor Mark Carney may continue to tame interest-rate expectations as officials argue ‘monetary policy can respond, in either direction,’ and the central bank may merely try to buy more time at the May 11 meeting especially as Prime Minister Theresa May plans to hold a snap election in June.
- With that said, more of the same from the BoE may instill a long-term bearish outlook for GBP/USD as the central bank remains in no rush to start normalizing monetary policy, while the Federal Open Market Committee (FOMC) appears to be on course to implement higher borrowing-costs over the coming months.
- A break/close above the Fibonacci overlap around 1.2860 (61.8% retracement) to 1.2950 (23.6% expansion) may open up the next topside target around 1.3090 (38.2% retracement) to 1.3120 (78.6% retracement), but failure to push above the former-support zone may spur a near-term pullback, with the first downside hurdle coming in around 1.2630 (38.2% expansion) to 1.2680 (50% retracement) followed by 1.2460 (61.8% expansion) to 1.2490 (38.2% retracement).
|
Currency |
Last |
High |
Low |
Daily Change (pip) |
Daily Range (pip) |
|
110.94 |
110.96 |
109.60 |
117 |
136 |
USD/JPY Daily
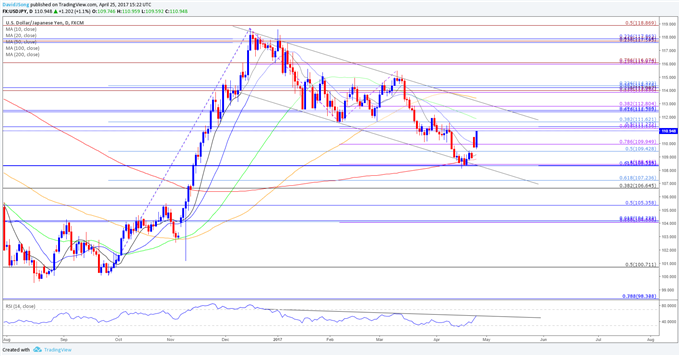
Chart - Created Using Trading View
- The Japanese Yen continues to lag behind its major counterparts, with USD/JPY extending the rebound from the Fibonacci overlap around 108.30 (61.8% retracement) to 108.40 (100% expansion)as market participants boost their appetite for risk, but the broader outlook remains tilted to the downside as the pair continues to operate within the descending channel carried over from late-2016.
- Nevertheless, the RSI may present a bullish trigger as the oscillator comes up against trendline resistance and threatens the bearish formation from earlier this year, with a topside break raising the risk for a shift in market behavior.
- The Yen stands at risk of facing additional headwinds going into the Bank of Japan’s (BoJ) policy meeting, with the central bank largely anticipated to endorse a dovish outlook for monetary policy, and Governor Haruhiko Kuroda and Co. may keep the door open to furthers support the real economy as officials struggle to achieve the 2% target for inflation.
- In contrast, Fed Fund Futures are now pricing a greater than 70% probability for a June rate-hike even as the U.S. remains at risk for a government shutdown, and expectations for higher borrowing-costs may keep USD/JPY afloat in May as market participants appear to be treating the greenback as a higher-yielding currency.
- In turn, topside targets remain in focus going into the end of the month, with USD/JPY coming up against the first hurdle around 111.10 (61.8% expansion) to 111.60 (38.2% retracement), with a break/close above the Fibonacci overlap opening up the next region of interest around 112.40 (61.8% retracement) to 112.80 (38.2% expansion).
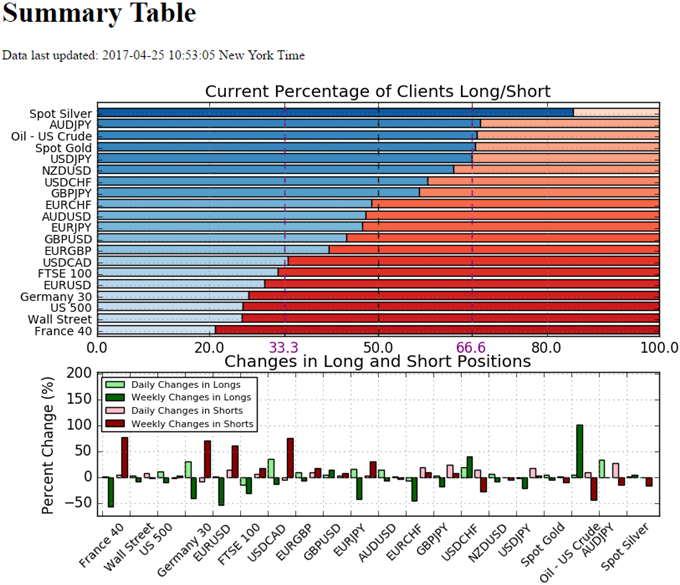
- Retail trader data shows 44.4% of traders are net-long GBP/USD with the ratio of traders short to long at 1.25 to 1. In fact, traders have remained net-short since April 12 when GBP/USD traded near 1.24863; price has moved 2.6% higher since then. The number of traders net-long is 3.8% higher than yesterday and 13.8% higher from last week, while the number of traders net-short is 3.1% higher than yesterday and 8.6% higher from last week.
- Retail trader data shows 66.6% of traders are net-long USD/JPY with the ratio of traders long to short at 1.99 to 1. In fact, traders have remained net-long since Jan 09 when USD/JPY traded near 117.616; price has moved 5.8% lower since then. The number of traders net-long is 1.7% lower than yesterday and 21.0% lower from last week, while the number of traders net-short is 17.9% higher than yesterday and 2.4% higher from last week.
Disclosure: Have a question about trading the US Dollar? more
How did you like this article? Let us know so we can better customize your reading experience.

Comments
Leave a comment to automatically be entered into
our contest to win a free Echo Show.

