
FTSE 100 Trades Near Record High, Pattern Projection
On Monday, we looked at the bullish breakout in the FTSE 100 from the inverse head-and-shoulders pattern we first noticed taking shape last week. The pop out of the formation took the market to less than a point away from our first target at the record high at 7123 (7122.7 if you’re counting change). Close enough to call it achieved.
There is still room to run if it can clear the record high hurdle; the projected measured move target, based on the depth of the inverse H&S, remains towards 7185. It would require a break below yesterday’s low at 6983 to put us on the defensive in the immediate future.
FTSE 100: Daily
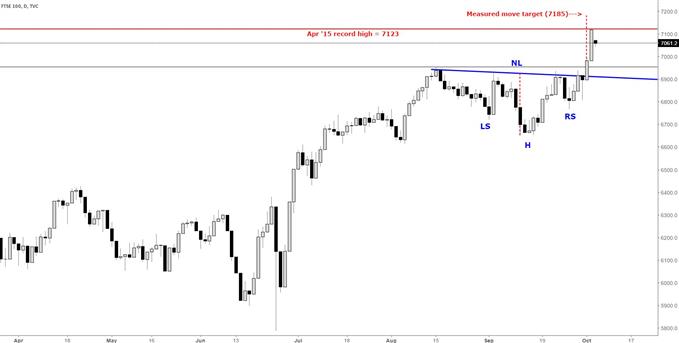
Created in Tradingview
Keep one eye on the pound: The market has greatly benefitted from a weaker exchange rate due to the FTSE’s large composition of multi-national companies who make their profits outside of the borders of the UK, thus boosting earnings when profits are converted into sterling. (Similarly, to how the weak euro in H2 2014 to H1 2015 helped fuel the massive run-up seen in the DAX and other European indices.)
For traders who have been holding a long position, using a trailing stop strategy makes sense given the potential for the FTSE to trade at new record highs and continue higher. For those looking to establish a new position, a consolidation or small pullback may offer a good opportunity to establish a trade with a good risk/reward profile. But be careful not to chase the market higher as risk of a reversal becomes elevated the higher the market goes, even at new record highs. The market can play cruel tricks on those who chase.
Subscribe to Jamie Saettele's distribution list in order to receive a free ...
more

