
Forex Strength And Comparison For Week 13 / 2017
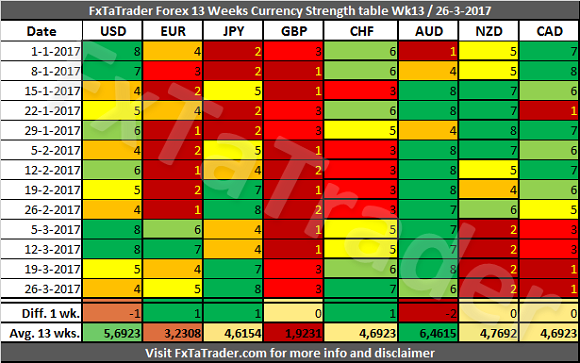
In the Currency Strength table, the JPY was the strongest currency while the CAD was again the weakest. There were a lot of changes last week but with just a difference of 1 point. The EUR, JPY, CHF gained all 1 point while the USD and AUD lost 1 point. The other Currencies remained at the same level.
13 Weeks Currency Score Strength
This data and the "13 weeks Currency Classification" are considered for deciding on the preferred range. Because it is not ideal nor desired to change the range for a currency every single week, we perform several checks to avoid this.
1. First of all the strength over a period of the last 13 weeks is considered. See each row for more information.
2. Next, the 13 weeks average is considered, see the last row called "Avg. 13 wks."
3. The number of weeks that a currency was stronger than another currency can also be considered.
4. The Technical Analysis (TA) Charts for each Time Frame could also be consulted.
For analyzing the best pairs to trade looking from a longer-term perspective the last 13 weeks Currency Classification can be used in support.
This was updated today and is provided here for reference purposes:
Strong: USD, AUD. The preferred range is from 7 to 8.
Neutral: JPY, CHF, NZD, CAD. The preferred range is from 3 to 6.
Weak: EUR, GBP. The preferred range is from 1 to 2.
When looking at the Average 13 wks. Score the AUD remains the strongest of all while the GBP remains the weakest. The NZD and CAD lost a lot of strength in the last 4 weeks. The Average 13 wks. score are very close to the CHF which is a Neutral currency. For that reason, these currencies are now also classified as neutral.
Classification review
The NZD and CAD lost a lot of strength lately and as can be seen below. These currencies are classified as Neutral currencies.
They are both in a dip and there is no sign of bottoming yet. In the last 6 months, the CAD bottomed also in January and October 2016 and the NZD had a few small dips. These currencies remained further strong during the last 6 months. Below is the Weekly Currency Score Chart with the 6 months' data as a reference.

Currency Score Comparison
"Comparison table" and the "Ranking and Rating list"
The Forex Currency Comparison Table compares each currency with its counterpart based on the Currency Score. For more information about the currency Score of this week, you can read the article "Forex Ranking, Rating and Score".
By using the comparison table directly below you can get a view without the volatility and statistics as opposed to the "Ranking and Rating list". Only the strength of each currency against the counterparts is analyzed by using the Technical analysis charts of the 4 Time Frames that are also used for the "Ranking and Rating List".
The information from the Comparison Table is the source for calculating the "Ranking and Rating List" where this list additionally uses the volatility and statistics for creating the best and worst performer in the list from number 1 to 28.
The text "Approved" mentioned in the `Currency score comparison table` has been taken out. The reason is that the information is published once a week and the rates change during the week. The mentioned scores also change and different opportunities may show up during the week. It seems then better to provide only the currency Score difference. Depending on the development of the rates during the week a Score difference of e.g. 3 may become more interesting than a Score difference of e.g. 5.
There are many ways to follow the rate changes during the week. This can be done e.g. by looking at the charts of course and checking e.g. the Ichimoku and/or MACD in the Daily and 4 Hours chart. There are also many tools, apps and websites where the development of rates of currencies is shown in different automated ways. This may be by pips or percentage difference or by comparing the values of indicators like the RSI, Moving Averages, MACD, Ichimoku etc.

"Comparison table" and the "Currency Score Chart"
The additional value of this table compared to the Currency Score table is that the Comparison Table compares the strength between the currencies of each pair. By subtracting the strength of the weaker currency from the stronger currency we have a way to compare each pair combination.
The comparison table provides a way to compare currencies from a longer-term perspective of 13 weeks and also simultaneously taking the current trend into account. By coloring the currencies in the X and Y axis according to their Classification we can show what the best combinations are. In doing this we apply 2 rules to make it clearer.
1. Only better-classified currencies in combination with weaker classified currencies are Approved when there is a Currency Score difference of at least 1 in the current week.
2. The only exception is when 2 currencies are similarly classified but the Currency Score difference is equal to or more than 4.
3. Each currency should be as far apart from each other as possible in the range from 1 to 8. The classification of the currencies in question may change in the longer term. By using the difference of 4 which is exact at the half of the range it seems a safe approach for trading 2 currencies which are similarly classified.
4. Even though currencies may be in the same classification a currency may be in a weaker/stronger period and may even change its classification in the future. See the current classification for the coming period at the beginning of this article.
Putting the pieces together
Based on the last "13 Weeks currency classification" and the "Currency Comparison Table" the currencies for going long seem to be:
JPY and CHF.
These are Strong or Neutral currencies from a longer term perspective when looking at the last "13 Weeks currency classification".
For going short the same analysis can be done and the following currencies seem to fit best:
CAD, NZD and GBP.
These are Weak or Neutral currencies from a longer term perspective.
Currencies with a high deviation seem less interesting to trade because they are less predictable. A good example now is/are e.g. the:
JPY, CAD, EUR and USD.


