
Forex Forecast: Pairs In Focus - Sunday, Oct. 14
The difference between success and failure in Forex trading is very likely to depend upon which currency pairs you choose to trade each week, and not on the exact trading methods you might use to determine trade entries and exits. Each week I am going to analyze fundamentals, sentiment and technical positions in order to determine which currency pairs are most likely to produce the easiest and most profitable trading opportunities over the next week. In some cases it will be trading the trend. In other cases it will be trading support and resistance levels during more ranging markets.
Big Picture October 14
In my previous piece last week, I forecast that the best trades would be short of the AUD/USD, NZD/USD, and EUR/USD currency pairs. Unfortunately, they all rose: EUR/USD by 0.33%, AUD/USD by 0.87%, and NZD/USD by 1.09%, totaling an average loss of 0.76%.
Last week saw a rise in the relative value of the Japanese Yen, and a fall in the relative value of the Canadian Dollars.
Last week’s Forex market was dominated by weaker than expected U.S. inflation data, but this was largely overshadowed by a sharp fall in the value of the U.S. stock market, putting the S&P 500 index at lows close to correction territory, and seeing at least one daily close below the 200-day simple moving average.
Fundamental Analysis & Market Sentiment
Fundamental analysis tends to support the U.S. Dollar, as American economic fundamentals continue to look strong. Sentiment seems to be still in favor of the U.S. Dollar, and is increasingly in favor of the British Pound on Brexit. Fundamentals remain bearish on the Japanese Yen, but this currency can benefit from safe-haven “risk off” money flow.
The week ahead is likely to be dominated by the performance of stock markets and particularly the American stock market. The U.S. will be releasing the FOMC Meeting Minutes and we will get U.S. retail sales data as well as British inflation data.
Technical Analysis
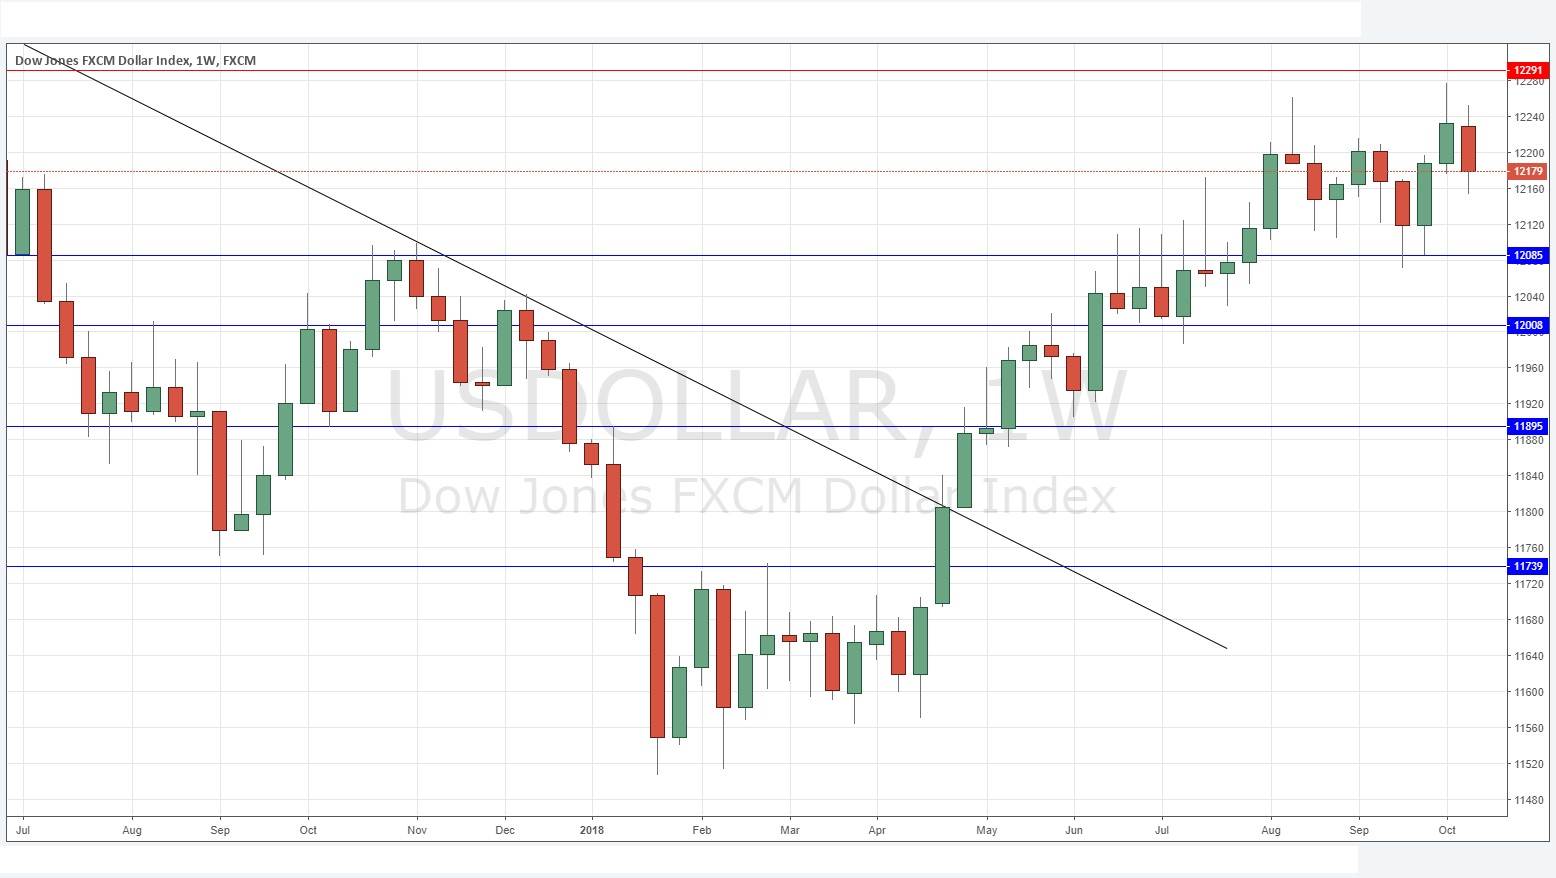
U.S. Dollar Index
The weekly price chart below shows that after last week’s quite bullish candlestick, the price fell over the week, printing a bearish candlestick, which closed in its lower half but above the support level at 12085. The price remains within a multi-week consolidation between support and resistance and I have no strong confidence as to short-term direction, although the edge is still technically in line with the long-term bullish trend, which remains intact.
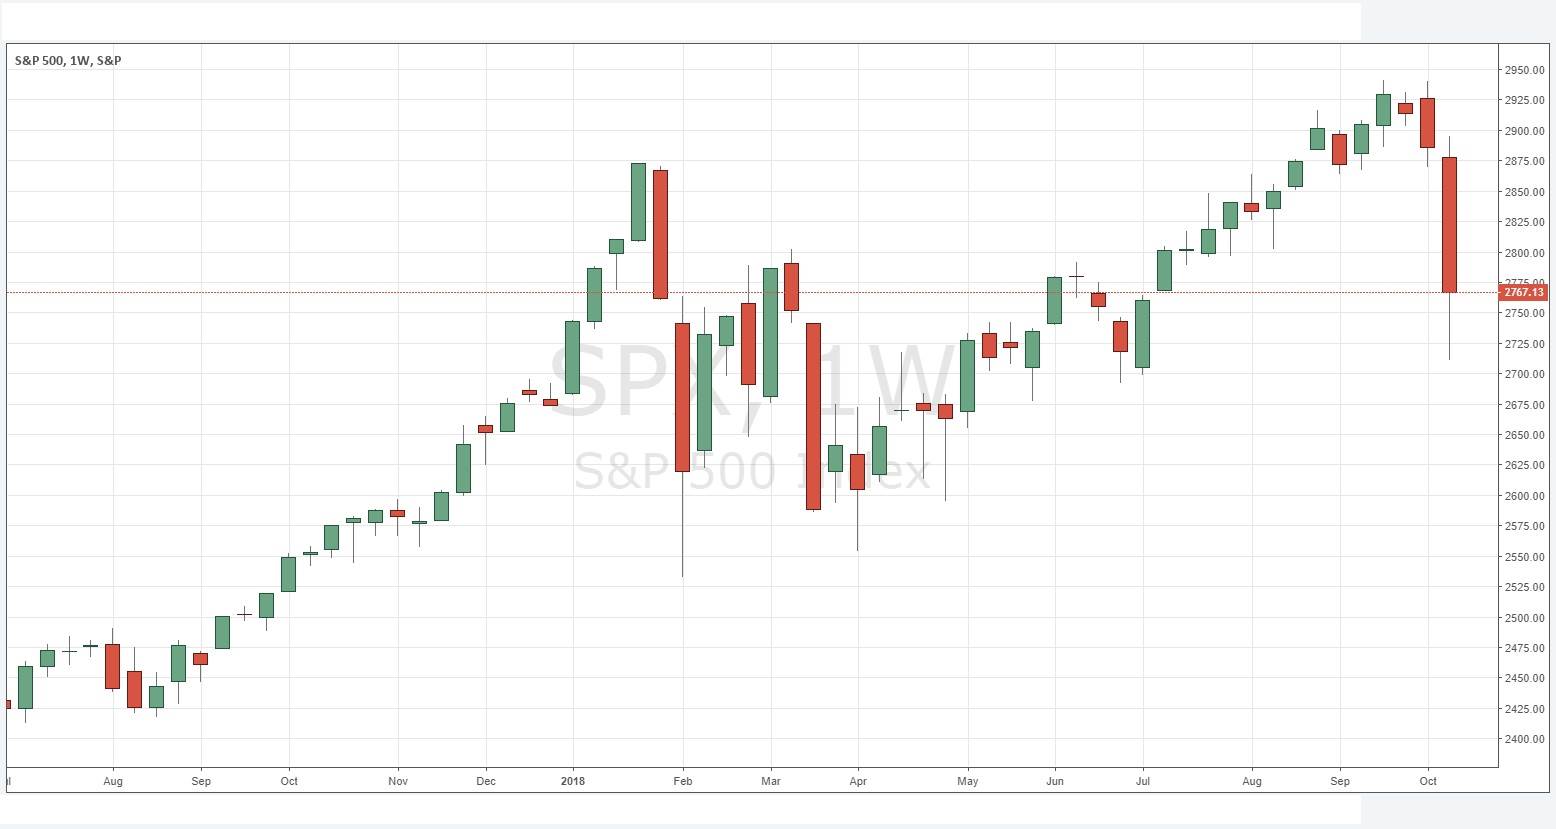
S&P 500 Index
Last week saw a strong, sharp fall in this stock market index, after it recently made a new all-time high. It was the strongest weekly movement since last March. The last day of the week saw a rejection of the lows and a close just above the 200-day moving average, which produced a notable lower wick on last week’s candle. As the price is still well above its level of 6 months ago, historical probabilities suggest a bullish recovery is likely over the coming week, but it may be slow and should be traded very carefully (if at all).
Conclusion
Bullish on the S&P 500 Index at the next daily close which is higher than the previous two days’ closing prices.
Disclosure: DailyForex will not be held liable for any loss or damage resulting from reliance on the information contained within this website including market news, analysis, trading signals ...
more

