
Flying Blind, Part 3: Why Now Is Not The Time And Place For Nosebleed PE Multiples
As we indicated in Part 2, the very idea that you would pay 26X EPS for the S&P 500 at the tail end of a 103-month-long recovery cycle is truly ludicrous. That is, there is a time to anticipate strong profits rebound during the early years of a recovery, thereby meriting a robust PE multiple.
But there is also the obvious point that expansions eventually become long in the tooth and end in recession. Even by the lights of the central bank money printers, the business cycle has not yet been outlawed.
After all, that's why the Eccles Building is now motoring head-down and straight into an epochal pivot which it is pleased to call interest rate "normalization" and balance sheet shrinkage (QT). In plain English, however, that is just central banker-speak for bond dumping on an unprecedented and epic scale. And it is being done out of deathly fear that the next recession will make its appointed rounds with the Fed out of dry powder and impotent.
Folks, these people aren't totally stupid. They have amassed extraordinary power and plenary dominance over the nation's $19 trillion capitalist economy only by assiduously cultivating the mother of all Big Lies. Namely, the myth that private capitalism is dangerously unstable and possessed of an economic death wish for periodic cyclical collapses, which can be forestalled only by the deft interventions of the central bank.
That's self-serving malarkey, of course. Every recession of the modern Keynesian era has been caused by the Federal Reserve, and most especially the calamity of 2008-2009. And the "recovery" from that one, as well as those stretching back to the 1950s, was owing to the inherent regenerative powers of the free market, not the interest rate and credit supply machinations of the Fed.
So what we really have is a case of the monetary Wizard of Oz. There is nothing behind the Eccles Building curtain except a posse of essentially incompetent economic kibitzers who spend 90% of the time slamming the same old "buy" key on the Fed's digital printing press, while falsely claiming credit for the inherent growth propensity of private capitalism.
Yet let the next recession/recovery cycle occur while the FOMC is sucking its thumb for want of capacity to slash interest rates, such as the 550 basis point cutting spree after both the 2000-o1 and 2008-09 recessions, and its curtains time for modern central banking. That's because the US economy would recover just as well with no artificial money market rate compression as it has done twice already this century after 550 basis points of the same.
So the real implication of QT and the Fed's upcoming $600 billion bond dumping campaign is not merely a drastic reset of the ultra-low interest rates that are now "priced-in" at 2850 on the S&P 500. The real message is that even the Keynesian central bankers are gathering acorns with extreme urgency in order to prepare for the next economic winter.
Needless to say, that's why the sell-side's ex-items hockey sticks pointing to 33% profits growth over the next two years are completely irrelevant at best, and a monumental con job, in fact. That's because all of history proves there is not a snowball's chance in the hot place that such "peak" cycle earnings levels can be sustained on a long-term basis.
For example, after the 119-month business cycle expansion of the 1990s, so-called "operating earnings"(or profits adjusted for the bad stuff) peaked at $56.79 per share in the LTM period for September 2000. But this peak level was not remotely sustainable.
In fact, earnings slumped by 32% to a low of $38.85 per S&P 500 share by the December 2001 reporting period. Not surprisingly, of course, the S&P 500 index also dropped by more than 35%during the period.
Likewise, during the 70-month expansion from early 2001, S&P 500 operating earnings reached a peak of $91.47 per share for the LTM period ending in June 2007. Thereafter, they plunged by 57%, bottoming eight quarters later at just $39.61 per share in September 2009. Similarly, the S&P index also plunged by 55% during that interval.
At that point, of course, corporate profits incepted still another climb out of the recessionary hole. But the starting point could not be more dispositive.
To wit, LTM "operating profits" at the September 2009 bottom were no higher than they had been nine-years earlier in September 2000. As if it were needed, that is proof beyond a shadow of a doubt that Wall Street hockey sticks at the tail end of the business cycle are pointless: Real world profits are slaves to the cycle of recovery and recession; they are not financial beanstalks which grow to the sky.
In the current instance, it is still early in the reporting season but already estimated GAAP earnings for 2017 have slid to just $110 per share. That compares to projected 2017 earnings of $122 per share as of January 2017 and $115 per share as of September.
To be sure, the latter is evidence of the same old, same old earnings revision scam which has been going on for decades but also underscores something far more crucial.
To wit, the earnings ball game for this cycle is already over. It doesn't matter how high the hockey sticks point for 2018 or 2019: The next big earnings move is smack dab into the recessionary dumpster---down 30% to 60% or even more.
Stated differently, at 2850 on the S&P 500 peak earnings of $110 per share are being valued at an ultra peak multiple (26X). Everywhere and always, however, that has been a formula for drastic post-crash losses.
At the same time, it should also be recognized that $110 per share of S&P 500 earnings at the penultimate stage of the business cycle is nothing to get excited about. To the contrary, it signifies that the trend growth rate of corporate profits has slumped into stall speed.
Thus, the 10-year growth rate now computes to just 2.4% per annum since the $85 per share prior cycle peak in June 2007, and barely 4.0% per year for two cycles running since the 2000 peak at $54 per share.
Stated differently, no one in their right mind should pay 26X for low single-digit earnings growth. The latter has barely compensated for inflation during the last 10 years and computes to just 2% per year in real terms over the entirety of this century to date.
So recognize the cloying sell-side meme that the market is merely pricing in a robust profits recovery for what it is. Namely, the drivel and bunkum of salesmen desperately looking for a mark.
Also, recall that a one-size-fits-all EPS multiple is complete nonsense. As we indicated in Part 2, the right valuation multiple crucially depends upon time and place. Yet anyone paying half attention can see that the current instance of the same is not at all propitious.
Back in September 2000, for example, when the S&P 500 earnings multiple of 26.7X peaked at almost exactly today's nosebleed level, the outlook was far more welcoming. At that point, the balance sheet of the Fed was a mere $500 billion, meaning that the newly ascendant Greenspan money printers had immense head-room to goose the economy with fraudulent central bank credit.
Self-evidently, that's the opposite of the Fed's current desperate need to shrink it's elephantine $4.4 trillion balance sheet in order to stay in the "stimulus" game. So doing, however, it is putting at extreme risk a hideously inflated stock market that has been fueled by systematically falsified interest rates, which, in turn, have been massively accessed by Wall Street carry-trade speculators and C-suite financial engineers, alike.
Likewise, back then the Federal budget profile was also far more benign. During the year 2000 there was a sizeable surplus in major part owing to capital gains realizations, but more importantly, Washington was engulfed in a debate about the prospective disappearance of the Federal debt entirely!
That's right. Even the Maestro himself had speculated about the existential challenge to the Fed's modus operandi that would occur if there was no public debt to monetize. In fairness, at that time Dick Cheney had not yet pronounced the "deficits don't matter" doctrine, nor had the GOP embarked upon two huge, unpaid for tax cuts.
Instead, analysts had simply assumed that the business cycle had been eliminated and that under the robust linear growth scenario projected through 2010 that surging Federal revenues and billowing annual surpluses would pay down the public debt by the end of that decade.
That was always a pipe dream, of course, but then again even a far more sober future outlook at the time was not remotely in the same ballpark as today's virtual certainty that the public debt will reach $40 trillion and 140% of GDP by the end of the 2020s.
In short, given the absolute certainty of a thundering bond market collision between fiscal and monetary policy in the years ahead, today's 26X peak S&P 500 multiple makes even less sense than it did in the year 2000. Even then, it eventually led homegamers to the slaughter; and that's to say nothing of the peak 17.7X multiple in June 2007 that soon led to another dose of the same.
In fact, today's nosebleed cap rates are nothing less than an invitation to financial self-obliteration. Unlike in September 2000 or June 2007, the evidence about the drastically diminished growth capacity of both the domestic and global economy is already recorded and beyond dispute.
In the case of the domestic economy, it is only the one-time but unsustainable rise in the profits share of GDP that has supported the punk 4.0% nominal growth rate of S&P 500 earnings since the turn of the century. By contrast, the real median income of US households at $59,039 is almost exactly where it stood way back in 1999.
Stated differently, real median household incomes have grown by just $22 per year for the entirety of this century; and that's before the next recessionary dip yo-yos it downward yet again.
Regardless of the precise timing of the next down-cycle, therefore, the conclusion recurs: There is no basis whatsoever in domestic economic performance for today's capitalization rates. No economy can grow robustly in the long run when the overwhelming share of households are dead in the water economically.

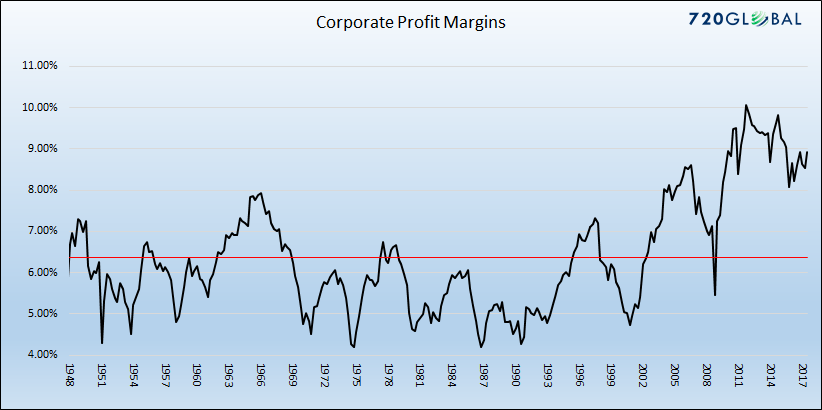
In fact, during the entirety of this century (except for recession quarters) corporate profit margins have dwelled far above historic norms. While we profess no special insight as to when and by how much they will revert to the long-run mean (red line in the graph), we are quite confident that the secular peak is already in. Earnings growth through profit share gain is over and done.
The prospective rise in interest rates from the false bottom where they have been pinned most of the time since the year 2000 will alone constitute an enormous headwind to present peak profit shares. There is currently upwards of $13 trillion of non-financial business debt outstanding compared to just $4 trillion at the turn of the century.
Accordingly, even a 250 basis point rise in average yields over the next several years would amount to $325 billion of increased interest expense or about 25% of current non-financial business profits before tax.
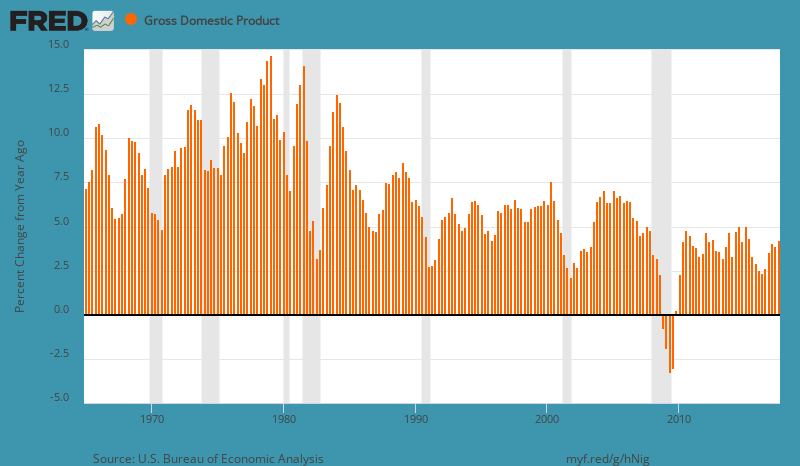
Data Courtesy: St. Louis Federal Reserve (FRED)
By the same token, the growth rate of nominal GDP---the economic stuff from which business profits are extracted----- has also slowed dramatically relative to historical trends. During the peak-to-peak period between 2007:4 and 2017:3, for example, the nominal GDP growth rate has clocked in at just 3.1%. That compares to 4.5% during the previous cycle and 5.6% between 1965 and the year 2000.
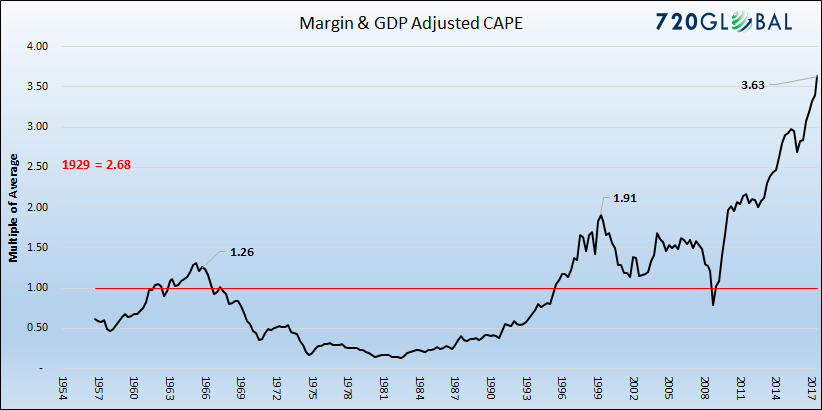
Needless to say, a combination of a weakening profits share of GDP and turgid growth of nominal income does not add-up to any kind of booming profits scenario on a long-haul across-the-cycle basis. Accordingly, as Michael Lebowitz has trenchantly noted, current PE multiples are even more egregiously bloated when earlier trends are adjusted for these factors.
As shown below, on Shiller's CAPE measure but adjusted for elevated margins and sharply slowing nominal GDP growth, valuation multiples are just plain off the historical charts: They currently exceed by 35% the previous all-time high of 1929 and stand at more than 3.6X the modern historic average.
In the context of a temporarily wobbly dollar, of course, the perma-bull have one last straw to grasp onto. That is, the claim that it will all be made up in the international arena, where an alleged cycle of "syncrh0nized global growth" will translate into soaring dollar profits.
We will take the unders on that one. As we have demonstrated repeatedly, the slight uptick in global trade and GDP growth during the last year and one-half is almost entirely attributable to the huge credit impulse that emanated from China as the Red Suzerains of Beijing prepared the economic table for Mr. Xi's coronation as the second coming of Mao during the 19th party Congress in October.
Our contention has been that credit growth in China has subsequently hit stall speed compared to 40% plus rates of state-driven expansion in during much of 2016-2017. And when China's $40 trillion credit machine slows, so does world trade, and, with a lag, global growth.
Not surprisingly, South Korea is considered to be the canary in the global coal mine because its efficient, high-tech economy functions as a staging yard for China's more mundane and end-stage industrial output.
In that context, last night's report on South Korea's Q4 GDP and export trade was a bell-ringer. Exports growth plunged by an amount not witnessed since 1985 and quarterly GDP printed negative for only the third time this century.

We'd say you have been warned. We'd also say that this particular time and place is surely no occasion for a 26X PE multiple.


Good Article!