
Evaluating The Chinese Devaluation
The 2% devaluation of the Chinese yuan on Monday, and subsequent 1.6% weakening on Tuesday, was variously described as surprising and stunning. I think it was to be expected, given China’s slowing growth, although there was no particular reason to believe Monday would be the day. In evaluating the effects, one has to first place the drop in context.
The devaluation against the dollar was quite marked, as shown in Figure 1.
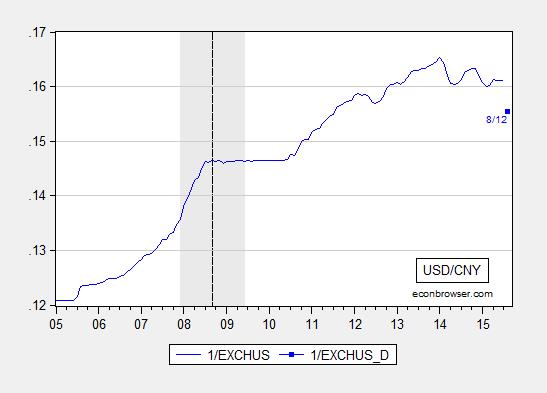
Figure 1: US dollars per Chinese yuan, average per month (blue), and value for 8/12 (blue square). NBER defined recession dates shaded gray. Dashed line at Lehman (2008M09). Source: Federal Reserve Board via FRED.
However, it’s important to recall that the dollar has had a rapid ascent over the past year, so that the real trade weighted value of the yuan has also been rising. This is shown in Figure 2.
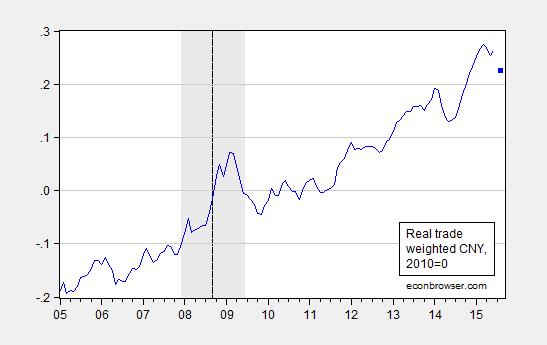
Figure 2: Log broad value of real trade weighted Chinese yuan, 2010=0 (blue) and value for 2015M08 assuming 2% depreciation relative to 2015M06. NBER defined recession dates shaded gray. Dashed line at Lehman (2008M09). Source: BIS and author’s calculations.
Already, there is talk of “currency wars”. From Washington Post:
Stephen Roach, a fellow at Yale University who formerly served as a non-executive chairman for Morgan Stanley in Asia, told Bloomberg that the move raised the “possibility of a new and increasingly destabilizing skirmish in the ever-widening global currency war.”
There is no doubt that this move will tend to further appreciate the dollar. China accounts for 21.3% of the weight in the Fed’s broad currency basket dollar index.[1] But as shown in Chinn (2015), several East Asian currencies already quasi-peg to the yuan, so that a weight of about 1/3 is probably more relevant. Figure 3 depicts the implied appreciation of the dollar’s value against a broad basket assuming all other bilateral weights experience zero change, and East Asian currencies move one for one with the yuan.
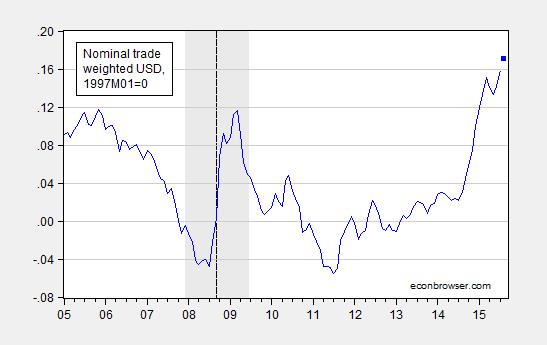
Figure 3: Log broad value of nominal trade weighted dollar, 1997M01=0 (blue) and value for 2015M08 assuming 2% yuan depreciation relative to 2015M07, along with other East Asian currencies; see text. NBER defined recession dates shaded gray. Dashed line at Lehman (2008M09). Source: Federal Reserve Board and author’s calculations.
While the impact is substantial, I think the language of “currency war” is a little overblown. In addition, it’s important to disentangle the impact on markets emanating from the policy action specifically (a weaker yuan has negative implications for US firms exporting to China) from the news component (devaluation being interpreted as Chinese policymaker worry about the economy based on insider information).
Returning to the “currency war” issue, on a point that I’ve stressed before, an expansionary monetary policy that depreciates a currency and only re-allocates aggregate demand will certainly have implications for the international distribution of output and welfare. However, if monetary authorities globally are pursuing a too tight policy, and the Chinese devaluation constrains further tightening (because of aversion to currency appreciation), then it’s not clear what the overall implications are.
Obviously, the outcome depends on what policymakers do. For the US, I believe this is yet more reason to defer monetary tightening [1]. After all, even before the Chinese devaluation, the dollar had appreciated on a broad basis by 13.7% (log terms) in the past year, putting downward pressure on inflation and aggregate demand. Although manufacturing employment some resilience in the last release, I think it’s far too soon to be complacent.
Disclosure: None.


