
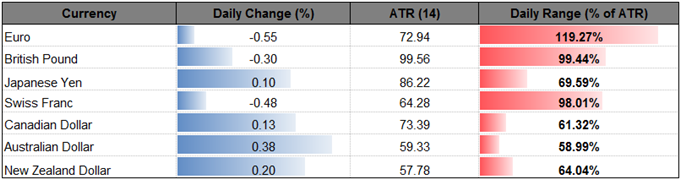
EUR/USD Slumps Following Brexit; 2017 Bullish Formations At Risk
|
Currency |
Last |
High |
Low |
Daily Change (pip) |
Daily Range (pip) |
|
AUD/USD |
0.7662 |
0.7666 |
0.7631 |
29 |
35 |
AUD/USD Daily
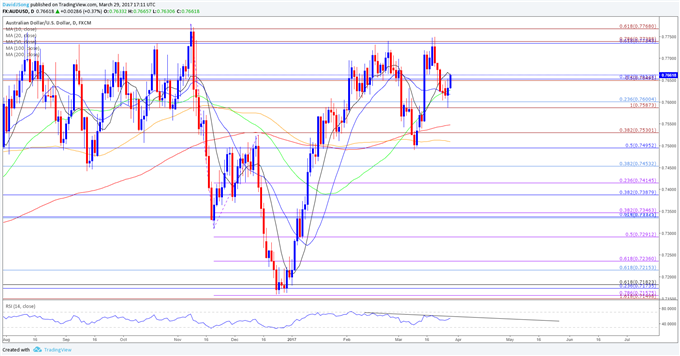
Chart - Created Using Trading View
- AUD/USD appears to be making a run at the 2017 high (0.7749) with the former-resistance zone around 0.7590 (100% expansion) to 0.7600 (23.6% retracement) offering support, but the pair may continue to operate within the 2016 range amid the ongoing divergence in the Relative Strength Index (RSI); need to see the oscillator break the bearish formation carried over from February to favor a broader advance in the exchange rate.
- Even though the Reserve Bank of Australia (RBA) is widely expected to retain the current policy at the April 4 meeting, a recent report by Fitch Ratings noted ‘all four of the major banks - ANZ, CBA, NAB and Westpac - this month increased lending rates, primarily on investor and interest-only mortgages, which runs counter to the Reserve Bank of Australia's (RBA) rate cutting cycle of recent years,’ and the pickup in private-lending rates may push Governor Philip Lowe and Co. to tame market expectations especially as ‘recent data continued to suggest that there had been a build-up of risks associated with the housing market.’
- Moreover, with the Federal Open Market Committee (FOMC) also anticipated to stay on hold at its next interest rate decision on May 3, the wait-and-see approach by both central banks may keep the aussie-dollar exchange rate within the 2016 range as market participants gauge the timing of the next rate-hike.
- With that said, a closing price above the 0.7650 (38.2% retracement) hurdle may generate another run at the key resistance zone around 0.7730 (61.8% retracement) to 0.7770 (61.8% expansion), but the pair may struggle to retain the advance from earlier this year as long as the RSI preserves the bearish formation from February.
|
Currency |
Last |
High |
Low |
Daily Change (pip) |
Daily Range (pip) |
|
EUR/USD |
1.0754 |
1.0827 |
1.0740 |
59 |
87 |
EUR/USD Daily
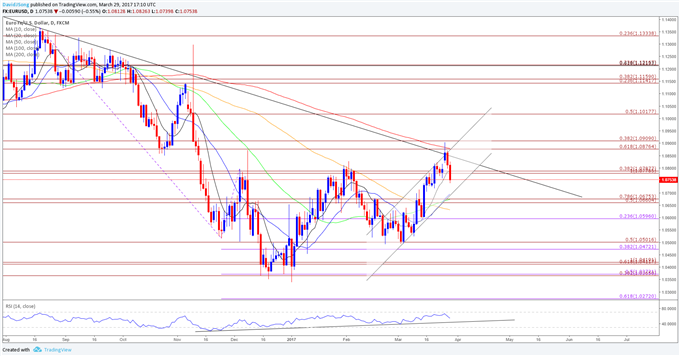
Chart - Created Using Trading View
- EUR/USD extends the decline from earlier this week as the U.K. formally triggers Article 50 of the Lisbon Treaty, with the pair at risk for further losses as it carves a near-term series of lower highs & lows; lack of momentum to push above the former-support zone around 1.0880 (61.8% expansion) to 1.0910 (38.2% expansion) may undermine the advance from earlier this month amid the failed attempt to break out of the downward trend carried over from 2016.
- The single-currency stands at risk of facing additional headwinds over the remainder of the week as the Euro-Zone’s Consumer Price Index (CPI) is anticipated to show a slowdown in both the headline and core rate of inflation, and the European Central Bank (ECB) may come under increased pressure to further support the monetary union as President Mario Draghi and Co. struggle to achieve their one and only mandate to ensure price stability; may see the Governing Council keep the door open to further extend the deadline for its quantitative easing (QE) program at the next meeting on April 27.
- Moreover, fresh rhetoric from Federal Open Market Committee (FOMC) officials (Dallas Fed President Robert Kaplan, New York Fed President William Dudley and Minneapolis Fed President Neel Kashkari) may weigh on EUR/USD especially as Fed Vice-Chair Stanley Fischer sees scope for two more rate-hikes in 2017; will continue to track market expectations as Fed Fund Futures still price a less than 60% probability for a move in June.
- In turn, a close below 1.0780 (100% expansion) may spur a move back towards channel support, which lines up with the Fibonacci overlap around 1.0660 (50% expansion) to 1.0680 (78.6% expansion); may see a similar reaction in the RSI, with the pair at risk of extending the bearish trend from 2016 should price & the oscillator struggle to preserve the bullish formations from earlier this year.
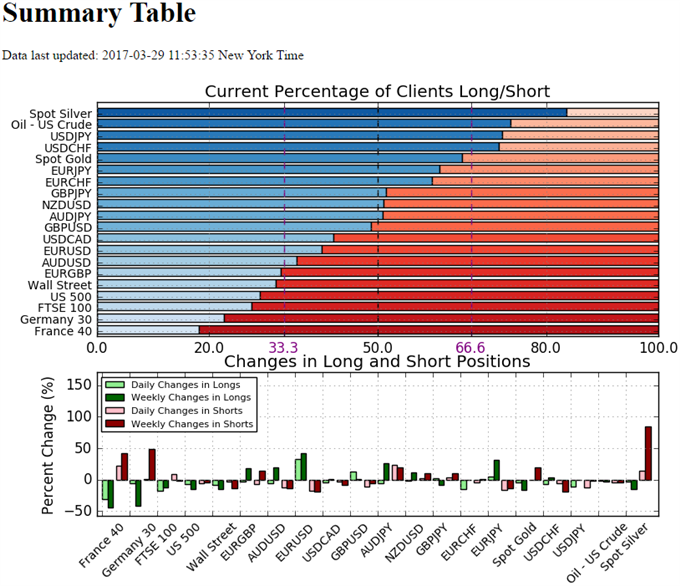
- The DailyFX Speculative Sentiment Index (SSI) shows retail position remains largely unchanged for the Euro and Australian dollar, with the crowd net-short EUR/USD since March 15, while traders have been net-short AUD/USD since January 9.
- Retail trader data shows 40.0% of traders are net-long EUR/USD with the ratio of traders short to long at 1.5 to 1. The number of traders net-long is 32.8% higher than yesterday and 42.6% higher from last week, while the number of traders net-short is 18.2% lower than yesterday and 18.3% lower from last week.
- Retail trader data shows 35.6% of traders are net-long AUD/USD with the ratio of traders short to long at 1.81 to 1. The number of traders net-long is 5.2% lower than yesterday and 20.2% higher from last week, while the number of traders net-short is 12.5% lower than yesterday and 13.1% lower from last week.
Disclosure: Are retail traders buying or selling the US Dollar, and what does say about the trend more
How did you like this article? Let us know so we can better customize your reading experience.

Comments
Leave a comment to automatically be entered into
our contest to win a free Echo Show.

